


Section 1: How to draw a flowchart
A flowchart is a visual representation of the sequence of steps and decisions needed to perform a process.
- Each step in the sequence is noted within a diagram shape.
- Steps are linked by connecting lines and directional arrows.
- This allows anyone to view the flowchart and logically follow the process from beginning to end.
Flowcharts help to identify all the key tasks involved and the finished chart can be used...
- as a springboard for further discussion of the process
- to connect with other flowcharts explaining related activities
- to identify points where data can be usefully collected and analyzed
- to isolate possible problem areas
- to communicate the process to those unfamiliar with it
There are no hard and fast rules for constructing flowcharts, but there are guidelines that are useful to bear in mind. Here are six steps that can be used as a guide for completing flowcharts.
- describe the process to be charted (this is a one-line statement such as, "How to process eCommerce transaction")
- start with a 'trigger' event
- note each successive action concisely and clearly
- go with the main flow (put extra detail in other charts)
- make cross references to supporting information
- follow the process through to a useful conclusion (end at a 'target' point)
Section 2: A set of useful standard symbols
It is not strictly necessary to use boxes, circles, diamonds or other such symbols to construct a flowchart, but these do help to describe the types of events in the chart more clearly.
Described below are a set of standard symbols that are applicable to most situations without being overly complex.
Rectangle or box – use it to represent an event that is controlled within the process. Typically, this will be a step or action that is taken. In most flowcharts this will be the most frequently used symbol.
Diamond – use it to represent a decision point in the process. Typically, the statement in the symbol will require a `yes' or `no' response and branch to different parts of the flowchart accordingly.
Rounded box – use it to represent an event that occurs automatically. Such an event will trigger a subsequent action, for example 'receive telephone call', or describe a new state of affairs.
Circle – use it to represent a point at which the flowchart connects with another process. The name or reference for the other process should appear within the symbol.
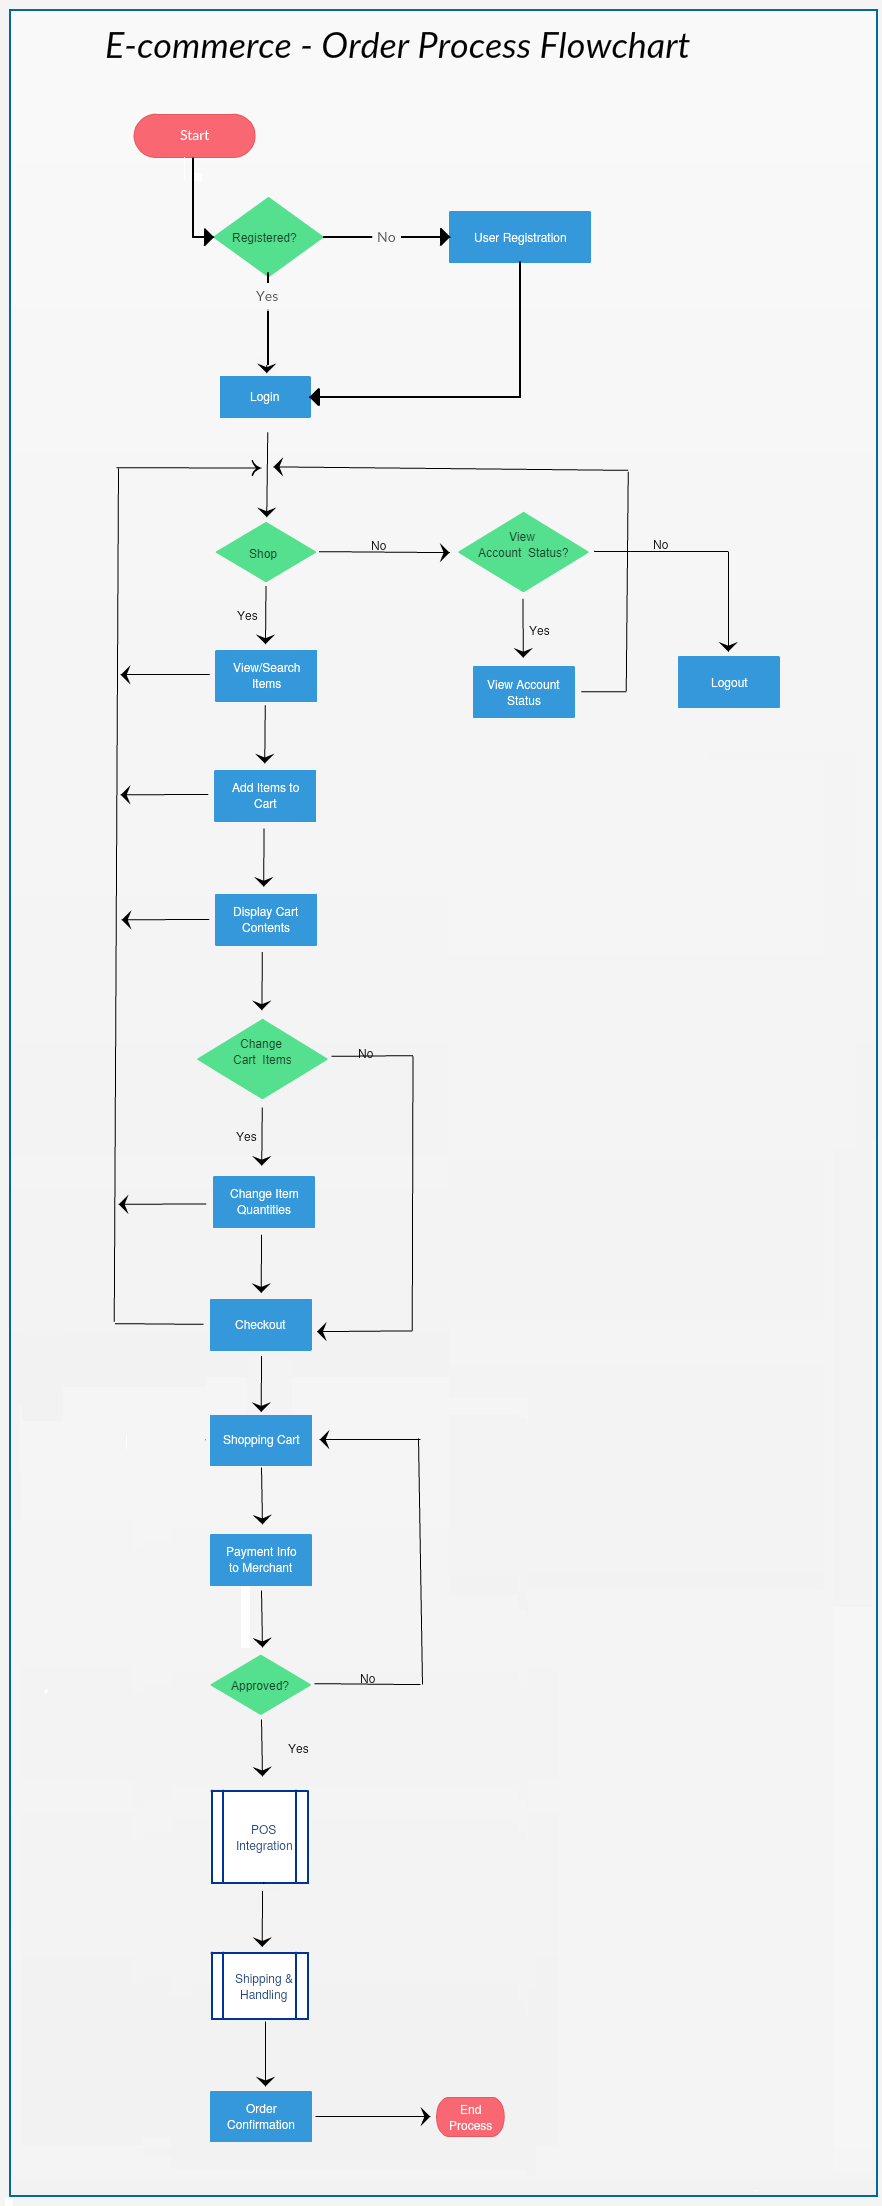
Section 3: Example
The best way to illustrate the use of these guidelines is to look at a simple example and follow how each step has been applied.
- The first step is to identify the process to be flowcharted and to give the chart a title. In this case, it is "Order Process".
- Begin to draw the chart by first describing the event that initiates the process (the "trigger"). In the example this is "Login/registration page accessed."
- Then note down each successive action taken. Actions should be described in as few words as possible, but make sure the description is not ambiguous or unclear.
- When you reach a point at which the flowchart branches into a number of alternatives, and the resulting complexity threatens to overwhelm the exercise, choose the most important alternative to continue flowcharting with. The others can simply be terminated and dealt with in separate flowcharts.
- Often you may need to make cross-references to important supporting information (in this example the point-of-sale system or the shipping and handling system).
- Continue describing each event, action or decision as it occurs in sequence, until the process is concluded. In the example, this point is reached when the order is submitted and the order confirmation generated.