


Section 0: Module Objectives or Competencies
| Course Objective or Competency | Module Objectives or Competency |
|---|---|
| The student will be able to employ appropriate systems design tools such as structure charts, process specifications, and dialog flow designers to design a system and its user interface. | The student will use Structure Charts to assist in modularizing a system and expressing inputs, outputs, and processing. |
Section 1: Definition
- A hierarchical representation of the time-independent flow of control among the functions of a system, a flow which is usually accomplished by calls to functions and their interfaces.
- The best tool for designing a modular, top-down system.
Quick Overview
Video: Introduction to Structure Charts
Example
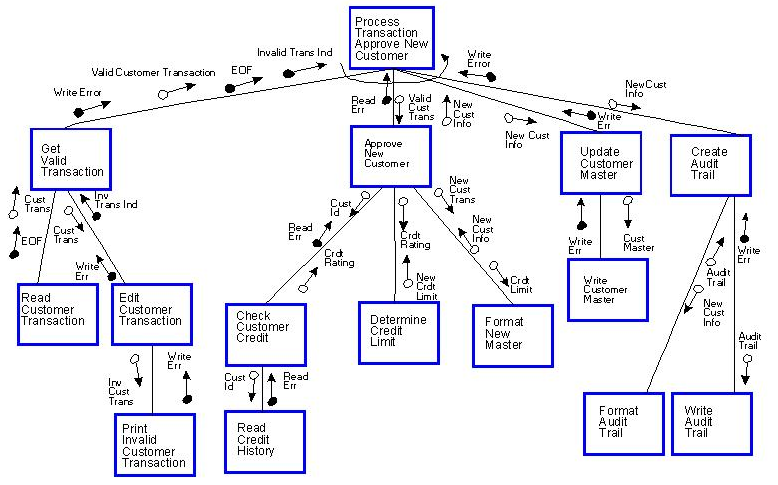
Example of Structure Chart
Section 2: Symbols
Structure charts consist of rectangular boxes, which represent modules, and connections.
Modules
- A collection of functions that act on the same object, i.e., a continuous set of statements that performs a specific task.
- Can be labeled in two ways:
- 1, 1.1, 1.2, etc., with the number to the right of the decimal point signifying that those modules are subsets of module 1.
- 100, 110, and 120, which allows the insertion of subordinate modules using a number between 110 and 120.
Connections
- A vector joining two modules, going from the calling module (supervisor) to the called module (subordinate).
- Each points downward since the structure chart is hierarchical, with the supervisor higher than its subordinates.
- Implies that there is an unconditional return to the supervisor when the subordinate terminates.
- Can be drawn with or without arrowhead.
Special Symbols
- Curved arrow
- Indicates iteration or looping when attached to a module.
- Indicates that some of the subordinate modules will be repeated until they are finished.
- See the final figure in these notes for an example.
- Diamond
- Indicates selection or conditional when attached to the bottom of a module.
- Signifies that only some of the modules below the diamond will be performed.
- Note:
- The diamond does not indicate which modules will be selected, and the loop does not indicate which modules will be repeated.
- They are meant to be general rather than specific.
- Both can be made more specific by restricting the drawing.
Section 3: Types of Modules
Control modules, or dispatchers
- Usually found near the top of the structure chart and contain the logic for performing the lower-level modules.
- Includes statements such as IF, PERFORM, and DO.
- Includes a few detailed statements such as ADD and MOVE.
- Should not be very large in size since control logic is usually the most difficult to design.
- Limited to three to nine subordinate modules; if more are needed then additional control modules should be introduced that are subordinate to the original control module.
- Logic may require a decision tree or decision table.
Transformational modules
- Are derived from the DFD.
- Usually perform only one task, although several secondary tasks may be associated with the primary task.
- Example: PRINT TOTAL LINE.
- Usually have mixed statements, a few IF and PERFORM or DO statements, and many detailed statements such as MOVE, ADD, etc.
- Are lower in the structure than control modules.
Functional modules
- Are the lowest in the structure, with a rare subordinate module below them.
- Perform only one task, such as formatting, reading, etc.
- Some of these modules can be found on the DFD, but in many cases they have to be provided.
Section 4: Types of Connections
Couple
- Represented by an arrow with an empty circle.
- Represents a data item that moves from one module to another.
- All shared or passed data must appear as a couple; one connection may have several couples; and each couple must be entered in the data dictionary.
- A module should receive only the data necessary to complete its task.
Switch (or flag) - boolean variable
- Represented by an arrow with a filled-in circle.
- Represents a specific type of couple that is set and tested in order to communicate information about some condition or other data item.
Guidelines
- Couples and flags should be kept to a minimum in order to enhance modifiability.
- While control is intended to return from lower-level modules to those higher in the structure, it may sometimes be necessary to pass control downward in the structure.
- If a flag is used for this purpose it indicates that a lower-level module is making a decision, resulting in a module that is performing two separate tasks, which is a violation of the ideal functional module – one that performs a single task only.
- The figure below demonstrates this situation, and the one following shows the solution.
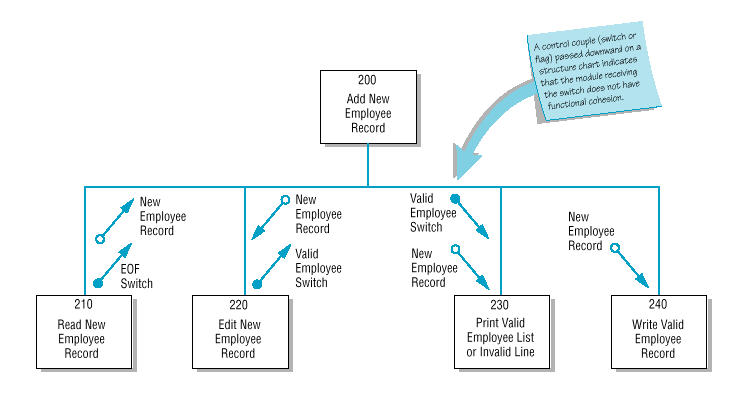
Incorrect structure chart
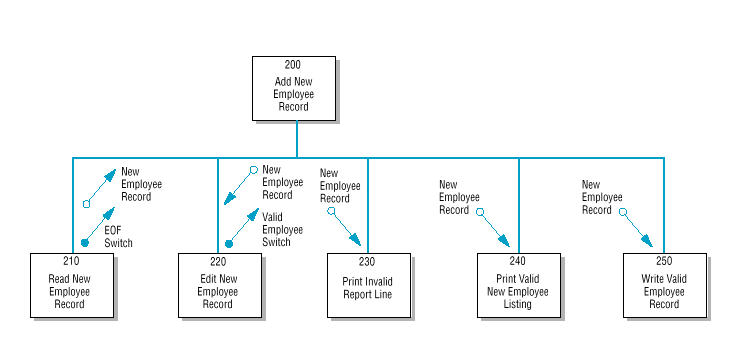
Correct structure chart
Section 5: Drawing A Structure Chart
Use of DFD
- In order to draw a structure chart it is best to begin with the data flow diagram, because the DFD provides the processes that will become modules.
- Since the DFD is intended to be a logical representation of the system, it is reasonable that the modules derived from the diagram are the same.
- This underscores the importance of designing a good DFD.
Process
- The main process shown on the context diagram corresponds to the main process on the top of the chart, and represents the module that controls everything underneath.
- The processes on Diagram 0 of the DFD provide the modules on the second level of the structure chart.
- The modules on the second level will control the operations of the modules on the third level.
- The data flows on the DFD become the data couples on the structure chart.
- The DFD indicates the sequence of the modules in a structure chart. If one process provides input to another process, the corresponding modules must be performed in the same sequence.
- If a process explodes to a child data flow diagram, the module corresponding to the parent process will have subordinate modules that correspond to the processes found on the child diagram.
Example
- The following figure shows the Level 0 DFD of a payroll system
with four processes, two data stores, and several data flows.
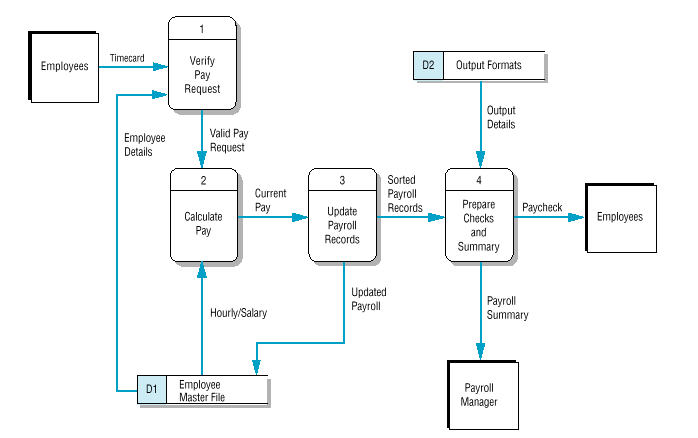
Original Data Flow Diagram
- The following figure shows the structure chart.

Resulting Structure Chart
- The main process at the top of the chart corresponds to the process shown in the context diagram, and represents the module that controls everything underneath.
- The modules on the second level have the same names and perform the same processes shown in the DFD.
- These third level modules accomplish the functions necessary to perform each calling routine.
- Each module performs only one function, which is the ideal case. In this example the data couples and flags are kept to a minimum.
- The symmetry shown in the example is not required.
Review
Video: SDD Structure Charts
Section 6: Functional Decomposition Diagram
A similar diagramming tool is the functional decomposition diagram.
- It resembles a structure chart that omits the couples and flags.
- The following figure shows a generic functional decomposition diagram.

Generic Functional Decomposition Diagram
- The next figure shows an example of a functional decomposition diagram for a ticket reservation system.
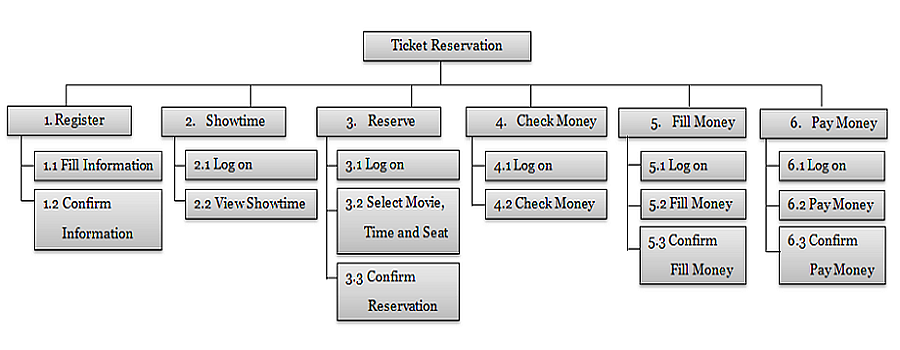
Functional Decomposition Diagram Example
Section 7: Resources
-
Video: Structure charts summary
-
Video: Structure Chart to Pseudo code - Sequence
-
Video: Structure Chart to Pseudo code - Decision
-
Video: Structure Chart to Pseudo code - Fixed Iteration
-
Video: Structure Chart to Pseudo code - Iteration - Pre-Test-loop
-
Video: Structure Chart to Pseudo code - Iteration - Post-Test-loop