Section 0: Module Objectives or Competencies
| Course Objective or Competency | Module Objectives or Competency |
|---|---|
| The student will be able to assess and apply Object-Oriented analysis and design methods like use cases to express user requirements, UML modeling, and other OO approaches. | Understand the process used to model business processes with activity diagrams. |
| Understand the rules and style guidelines for activity diagrams. |
Section 1: Overview
The behavior of a use case can be described by means of activity diagrams and state diagrams, interaction diagrams (sequence and communication diagrams), as well as textual use cases, where appropriate.
In its basic form, an activity diagram is a simple and intuitive illustration of what happens in a workflow, what activities can be done in parallel, and whether there are alternative paths through the workflow. (from developerWorks)
While activity diagrams may be used at several points in the development process, you can use activity diagrams to visualize the workflow of a business use case.
- Activity diagram can be used to model everything from a high-level business workflow that involves many different use cases, to the details of an individual use case, all the way down to the specific details of an individual method.
- UML 2 activity diagrams are typically used for business process modeling, for modeling the logic captured by a single use case or usage scenario, or for modeling the detailed logic of a business rule. (from agileModeling)
- Activity diagrams can be used independently of use cases for modeling a business-level function, such as registering for a college class, or even for modeling system-level functions, such as how a ticket reservation data mart populates a corporate sales system's data warehouse.
- See When to Use Activity Diagrams.
In many ways UML activity diagrams are the object-oriented equivalent of flow charts and data flow diagrams (DFDs) from structured development.
Video Overview
Here is a video overview of Activity Diagrams. Move to the 2:25 mark in the YouTube version:
Here is everything you need to know about Activity Diagrams: video :
Section 2: Benefits of Activity Diagrams
Activity diagrams depict the sequence of activities
- Diagrams are abstract and describe processes in general
- They model behavior independent of objects
- Can be used for any type of process
An activity diagram...
- Describes how activities are coordinated.
- Is particularly useful when you know that an operation has to achieve a number of different things, and you want to model what the essential dependencies between them are, before you decide in what order to do them.
- Records the dependencies between activities, such as which things can happen in parallel and what must be finished before something else can start.
- Represents the workflow of the process.
Drawbacks of Activity Diagrams
No stick figures - #sad!
Section 3: Using Activity Diagrams with Use Cases
- Start with a coarse-grained use case, which is composed of subordinate use cases.
- For the complicated subordinate use cases, use Activity Diagrams rather than Use Case Diagrams.
Activity Diagrams are like Flow Charts, but Flow Charts are usually limited to sequential activities while Activity Diagrams can show parallel activities as well.
Section 4: Elements of Activity Diagrams
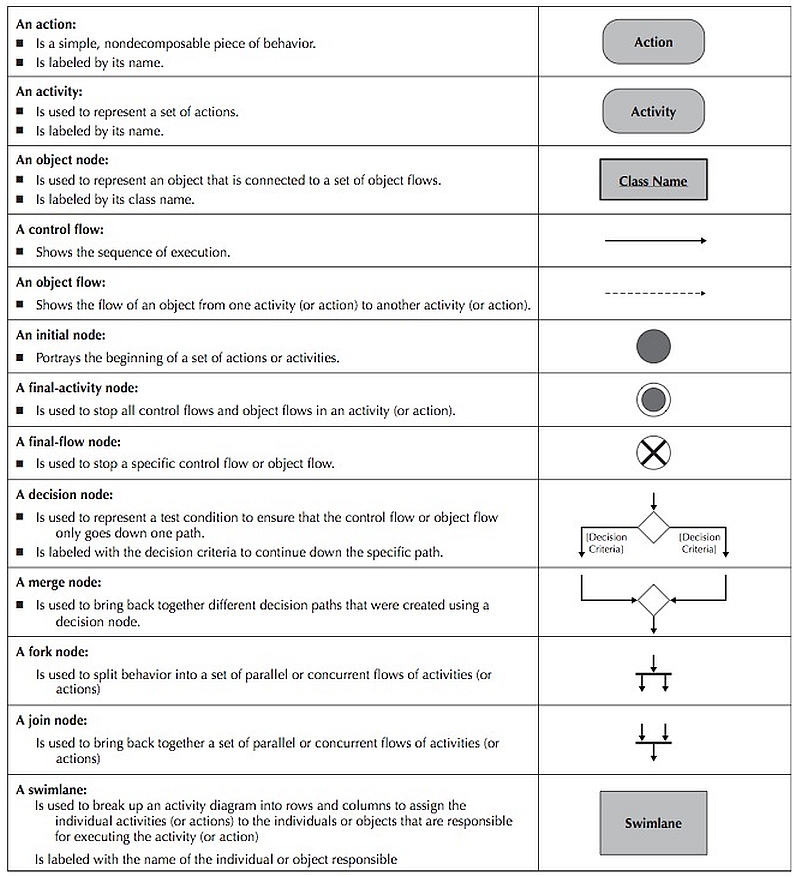
Actions and Activities
- Something performed for some specific business reason
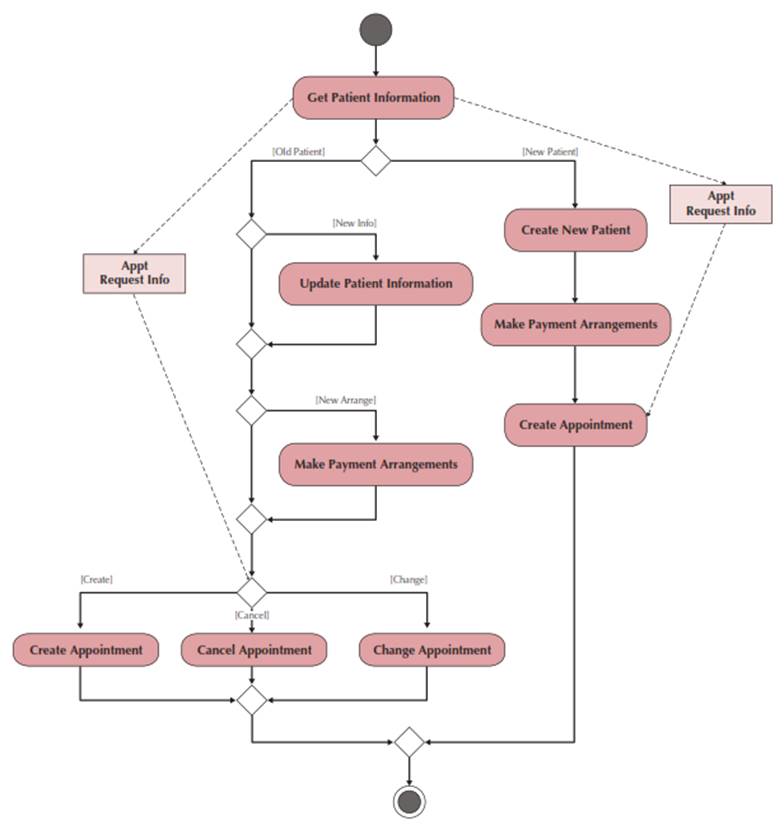
- Named with a verb and a noun (e.g., Get Patient Information)
- Activities can be further sub-divided; actions cannot
Object Nodes: represent the flow of information from one activity to another
Control Flows: model execution paths
Object Flows: model the flow of objects
Control Nodes: 7 types
- Initial node: the beginning of the set of actions/activities
- Final-activity node: stops all actions/activities
- Final-flow node: stops one execution path but allows others to continue
- Decision node: represents a test to determine which path to use to continue (based on a guard condition)
- Merge node: rejoins mutually exclusive execution paths
- Fork node: separates a single execution path into one or more parallel paths
- Join node: rejoins parallel execution paths
Section 5: States and Transitions
Activity diagrams can incorporate the following features - action states and activity states, transitions, branching, forking and joining, and swimlanes
Action States and Activity States
Activity diagrams commonly contain
- Activity states and action states
- Transitions
- Objects
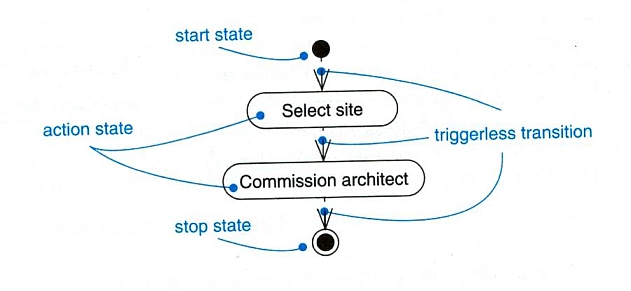
Action states are atomic and cannot be decomposed
- Work of the action state is not interrupted
Activity states can be further decomposed
- Their activity being represented by other activity diagrams.
- They may be interrupted.
Transitions
When the action or activity of a state completes, flow of control passes immediately to the next action or activity state.
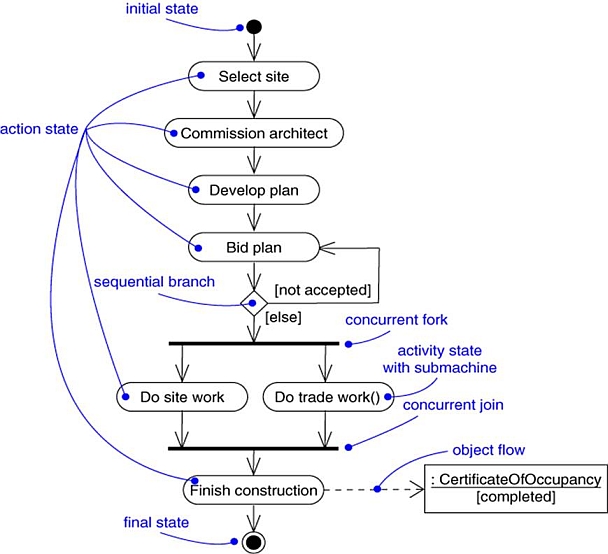
A flow of control has to start and end someplace
- initial state -- a solid disc
- stop state -- a solid disc inside a circle
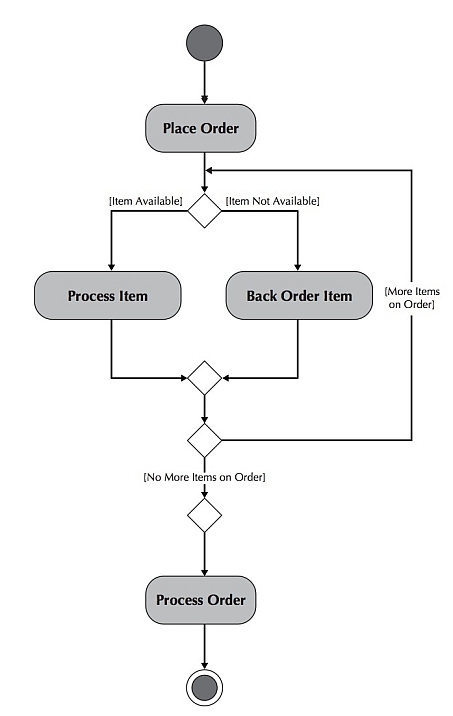
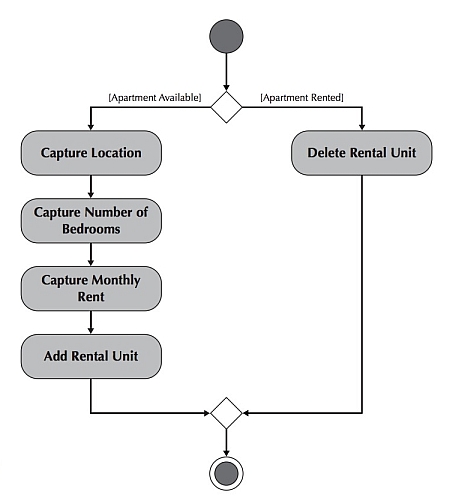
Section 6: Branching, Forking, and Joining
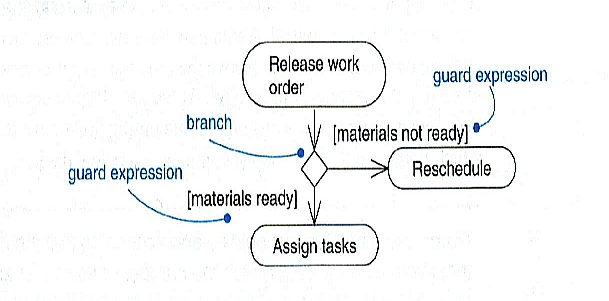
Branching
A branch specifies alternate paths taken based on some Boolean expression.
A branch may have one incoming transition and two or more outgoing ones.
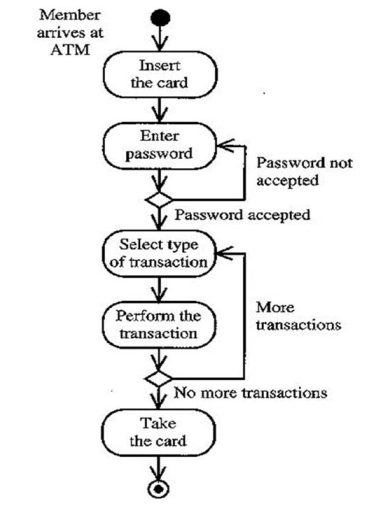
The following example of an ATM transaction includes branching.
Forking and Joining
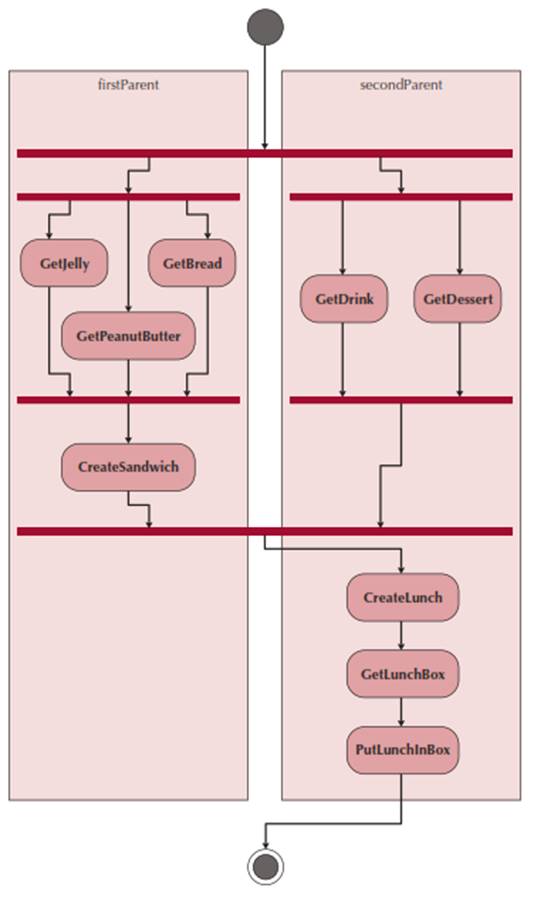
Use a synchronization bar to specify the forking and joining of parallel flows of control.
A synchronization bar is rendered as a thick horizontal or vertical line.
Fork
A fork may have one incoming transition and two or more outgoing transitions.
- Each transition represents an independent flow of control.
-
Conceptually, the activities of each of outgoing transitions are concurrent.
- They are either truly concurrent (multiple nodes)
- or sequential yet interleaved (one node).
Join
A join may have two or more incoming transitions and one outgoing transition.
- Above the join, the activities associated with each of these paths continue in parallel.
-
At the join, the concurrent flows synchronize.
- Each waits until all incoming flows have reached the join, at which point one flow of control continues on below the join.
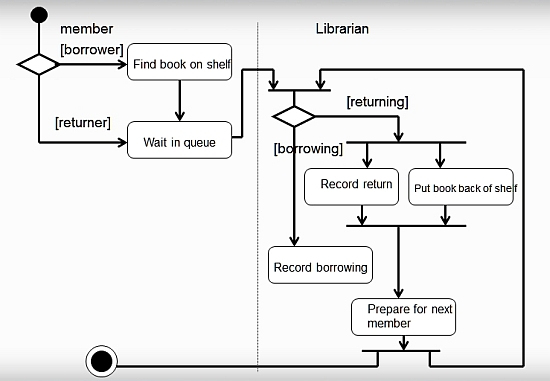
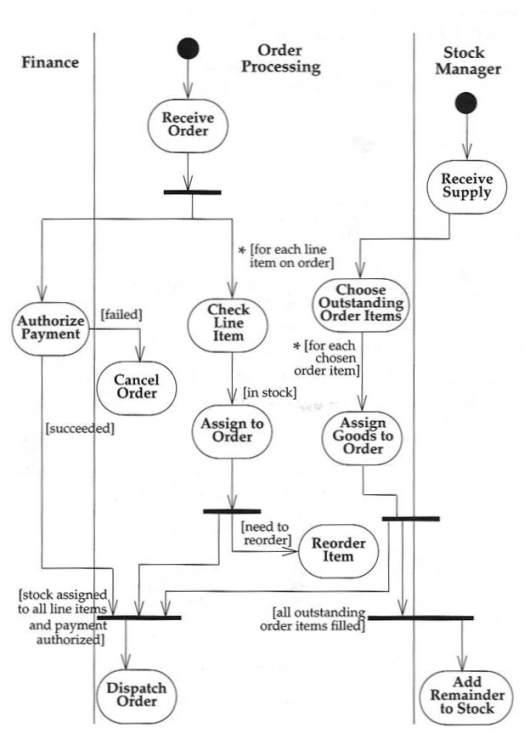
Section 7: Swimlanes
A swimlane is used to partition the activity states on an activity diagram into groups.
- Each group represents the business organization responsible for those activities.
- Used to assign responsibility to objects or individuals who actually perform the activity.
- Represents a separation of roles among objects.
Each swimlane is divided from its neighbor by a vertical solid line.
- Can be drawn horizontally or vertically, but vertical swimlanes seem more common.
Each swimlane has a name unique within its diagram.
Each swimlane may represent some real-world entity.
Each swimlane may be implemented by one or more classes.
Every activity belongs to exactly one swimlane, but transitions may cross lanes.
Each zone represents the responsibilities of a particular class (in this example, a particular department).
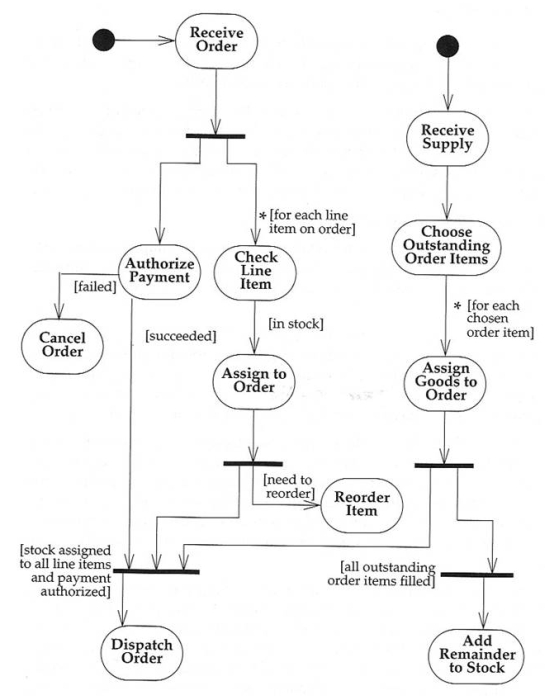
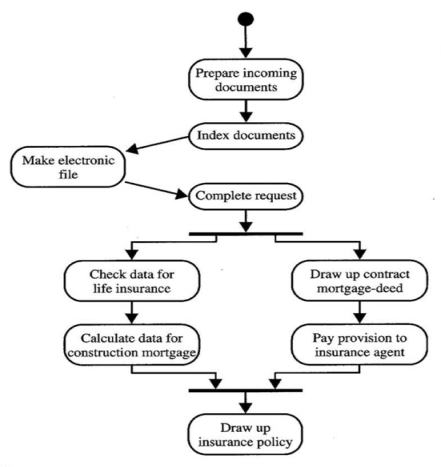
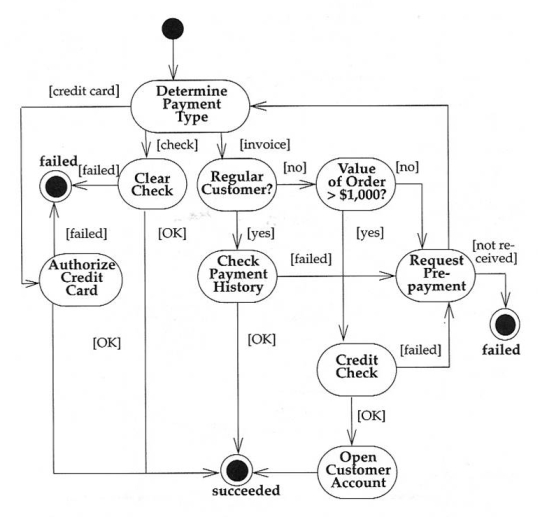
Section 8: Interpreting an Activity Diagram
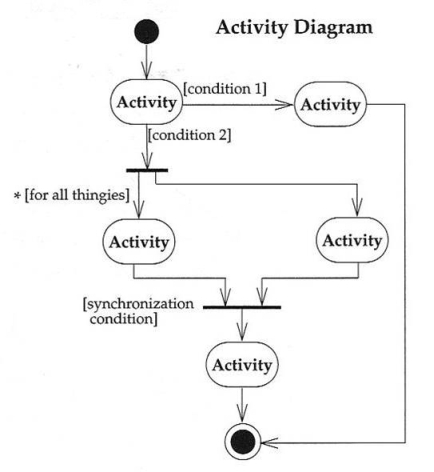
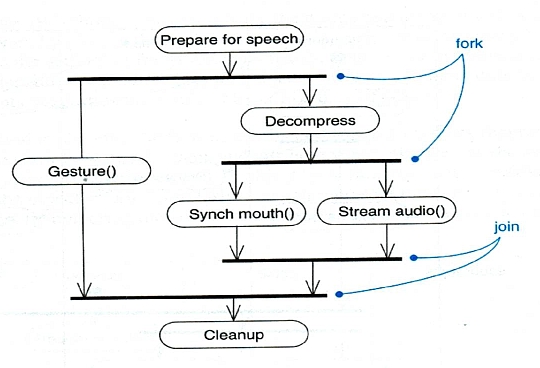
- Start at the top black circle
- If condition 1 is TRUE, go right; if condition 2 is TRUE, go down
- At first bar (a synchronization bar), break apart to follow 2 parallel paths
- At second bar, come together to proceed only when both parallel activities are done
An Example with Notation
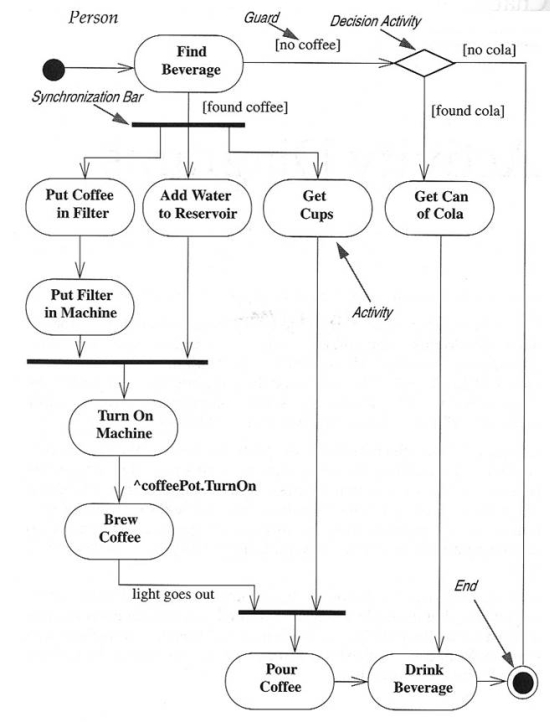
- Activity – an oval
- Trigger – path exiting an activity
- Guard – each trigger has a guard, a logical expression that evaluates to “true” or “false”
- Synchronization Bar – can break a trigger into multiple triggers operating in parallel or can join multiple triggers into one when all are complete
- Decision Diamond – used to describe nested decisions (the first decision is indicated by an activity with multiple triggers coming out of it)
Section 9: Developing Activity Diagrams
Guidelines for Activity Diagrams
- Set the scope of the activity being modeled.
- Identify the activities; connect them with flows.
- Identify any decisions that must be made.
- Identify potential parallelism in the process.
- Draw the activity diagram.
Creating an Activity Diagram
-
Choose a business process identified previously.
- Review the requirements definition and use-case diagram.
- Review other documentation collected thus far.
- Identify the set of activities used in the business process.
- Identify control flows and nodes.
- Identify the object flows and nodes.
- Lay out and draw the diagram (minimize crossing lines).
Section 10: Decomposing an Activity
An activity can be decomposed into a further Activity Diagram.
When an Activity Diagram represents a decomposition of a higher-level activity, there can be only one start point.
More in this supplemental example.
Section 11: Examples