


Section 0: Module Objectives or Competencies
| Course Objective or Competency | Module Objectives or Competency |
|---|---|
| The student will be able to list and explain the purpose of data analytics, along with more advanced approaches to data analytics including predictive analytics and data mining. | The student will be able to list and explain the purpose of data analytics |
| The student will be able to list and explain the purpose of predictive analytics, a more advanced form of data analytics. | |
| The student will be able to list and explain the purpose of data mining, a more advanced form of data analytics. |
Section 1: Overview
Data analytics involves the use of qualitative and quantitative techniques and processes to extract data from multiple sources – NoSQL databases, Hadoop data stores, and data warehouses – to analyze and identify behavioral data and patterns in order to provide decision support to all organizational users.
Data analytics is a subset of business intelligence (BI) functionality that encompasses a wide range of mathematical, statistical, and modeling techniques with the purpose of extracting knowledge from data.
Data analytics is used at all levels within the BI framework, including queries and reporting, monitoring and alerting, and data visualization.
- Hence, data analytics is a "shared" service that is crucial to what BI adds to an organization.
- Data analytics represents what business managers really want from BI: the ability to extract actionable business insight from current events and foresee future problems or opportunities.
Data analytics discovers characteristics, relationships, dependencies, or trends in the organization's data, and then explains the discoveries and predicts future events based on the discoveries.
- In practice, data analytics is better understood as a continuous spectrum of knowledge acquisition that goes from discovery to explanation to prediction.
- The outcomes of data analytics then become part of the information framework on which decisions are built.
Categories
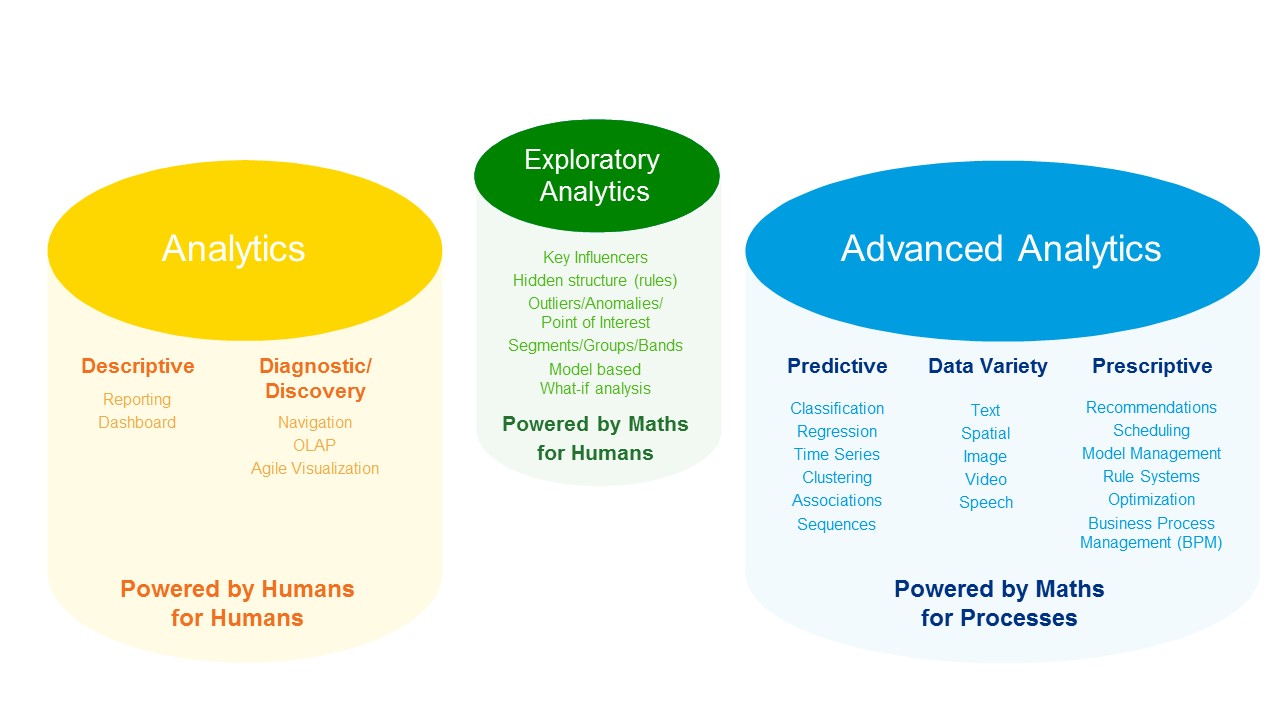
Data analytics can be categorized in various ways, including focuses on descriptive and exploratory analytics, predictive analytics, and prescriptive analytics.
- Descriptive analytics is used to search for and summarize historical data in order to identify patterns or meaning.
- Exploratory analytics is an approach for analyzing datasets to summarize their main characteristics, often with visual methods.
-
Predictive analytics focuses on predicting future data outcomes
with a high degree of accuracy.
- Sophisticated statistical tools are used to help create advanced models that answer questions about future data occurrences – for example, what would next month's sales be based on a given customer promotion?
-
Prescriptive analytics recommends actions a firm can take to affect those outcomes.
- Prescriptive analytics attempts to quantify the effect of future decisions in order to advise on possible outcomes before decisions are actually made.
- Prescriptive analytics predicts not only what will happen, but also why it will happen, providing recommendations regarding actions that will take advantage of the predictions.
Descriptive, Predictive, & Prescriptive Analytics
Data analytics has evolved over the years from simple statistical analysis of business data to dimensional analysis with Online Analytical Processing (OLAP) tools, and then from data mining that discovers data patterns, relationships, and trends to its current status of predictive analytics.
Section 2: Descriptive Analytics
Descriptive analytics is the process of using current and historical data to identify trends and relationships.
- It is sometimes referred to as the simplest form of data analytics because it describes trends and relationships.
Descriptive analytics involves parsing historical data to better understand the changes that have occurred in a business.
- Using a range of historic data and benchmarking, decision-makers obtain a holistic view of performance and trends on which to base business strategy.
Here is a thorough discussion of Descriptive Analytics Defined: Benefits & Examples.
Section 3: Exploratory Analytics
Exploratory analytics leverages historical data to answer questions and uncover trends and patterns through visualization, data and feature engineering, test execution, and other techniques.
Exploratory analytics apply methods and technologies to the task of helping the analyst finding useful insights in a dataset.
- Analysts can have a dataset automatically analyzed with data mining algorithms to find information about key influencers of measures, outliers, anomalies, points of interest, hidden structures (such as associations between values), groups of records showing similarities, bands of values having a common business meaning.
- Visualizations proposed by the solution would help the analyst to better grasp the meaning of the data in the dataset, its pertinence and value to the business problem.
-
The figure below shows how exploratory analytics enables analysts to go beyond classic analysis by means of automated, advanced algorithms and visualization techniques.
Exploratory analytics at the intersection of human driven and algorithmic aided analysis
Section 4: Predictive Analytics
Predictive analytics refers to the use of advanced mathematical, statistical, and modeling tools to predict future business outcomes with high degrees of accuracy.
Predictive Data Analytics in UNDER 5 Minutes
Data mining also has predictive capabilities, and data mining and predictive analytics use similar and overlapping sets of tools, but with a slightly different focus.
- Data mining focuses on answering the "how" and "what" of past data, while predictive analytics focuses on creating actionable models to predict future behaviors and events.
- Hence, predictive analytics can be viewed as the next logical step after data mining; once you understand your data, you can use the data to predict future behaviors.
Stimulus
With the proliferation of social media, companies turned to data mining and predictive analytics as a way to harvest the mountains of data stored on social media sites.
- Google was one of the first companies that offered targeted ads as a way to increase and personalize search experiences.
- Similar initiatives were used by all types of organizations to increase customer loyalty and drive up sales, such as airline and credit card industries and their frequent flyer and affinity card programs.
- Today, many organizations use predictive analytics to profile customers in an attempt to get and keep the right ones, which in turn will increase loyalty and sales.
Tools
Predictive analytics employs mathematical and statistical algorithms, neural networks, artificial intelligence, and other advanced modeling tools to create actionable predictive models based on available data.
- The algorithms used to build the predictive model are specific to certain types of problems and work with certain types of data.
- Therefore, it is important that the user, who typically is trained in statistics and understands business, applies the proper algorithms to the problem in hand.
- That said, modern BI tools automatically apply multiple algorithms to find the optimum model.
Uses
Most predictive analytics models are used in areas such as customer relationships, customer service, customer retention, fraud detection, targeted marketing, and optimized pricing.
Predictive analytics can add value to an organization in many different ways, such as helping optimize existing processes, identifying undetected problems, and anticipating future problems or opportunities.
Section 5: Prescriptive Analytics
Prescriptive analytics is a form of advanced analytics which examines data or content to answer the question “What should be done?” or “What can we do to make _______ happen?”, and is characterized by techniques such as graph analysis, simulation, complex event processing, neural networks, recommendation engines, heuristics, and machine learning.
- Prescriptive analytics is a form of data analytics that tries to answer "What do we need to do to achieve this?"
- It uses analytics techniques to help businesses decide a course of action based on a computer program’s predictions.
- Prescriptive analytics works with predictive analytics, which uses data to determine near-term outcomes.
- When used effectively, it can help organizations make decisions based on facts and probability-weighted projections instead of conclusions based on instinct.
For a detailed explanation, read What Is Prescriptive Analytics? How It Works and Examples.
What Is Prescriptive Analytics? Here's Everything You Need to Know
What is Prescriptive Analytics? - Data Science Wednesday
Section 6: Data Mining
Data Mining: How You're Revealing More Than You Think
- Data mining refers to analyzing massive amounts of data to uncover hidden trends, patterns, and relationships, to forming computer models to simulate and explain the findings; and then using such models to support business decision making.
- In other words, data mining focuses on the discovery and explanation stages of knowledge acquisition.
- Data mining can be used for both explanatory analytics and predictive analytics.
Data Mining Overview
To put data mining in perspective, look at the pyramid in the figure below, which represents how knowledge is extracted from data.
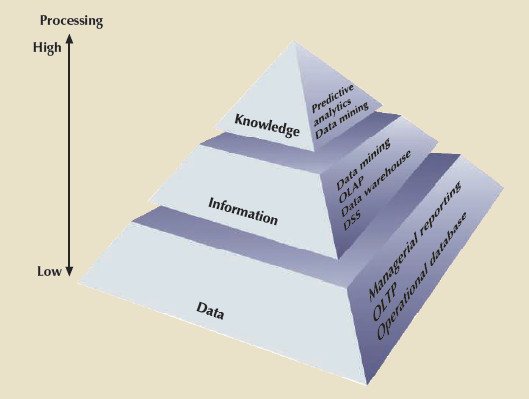
- Data forms the pyramid base and represents what most organizations collect in their operational databases.
-
The second level contains information that represents the purified
and processed data.
- Information forms the basis for decision making and business understanding.
- Knowledge is found at the pyramid’s apex and represents highly distilled information that provides concise, actionable business insight.
Specificity
Current-generation data-mining tools contain many design and application variations to fit specific business requirements.
- Depending on the problem domain, data-mining tools focus on market niches such as banking, insurance, marketing, retailing, finance, and health care.
- Within a given niche, data-mining tools can use certain algorithms that are implemented in different ways and applied over different data.
Phases
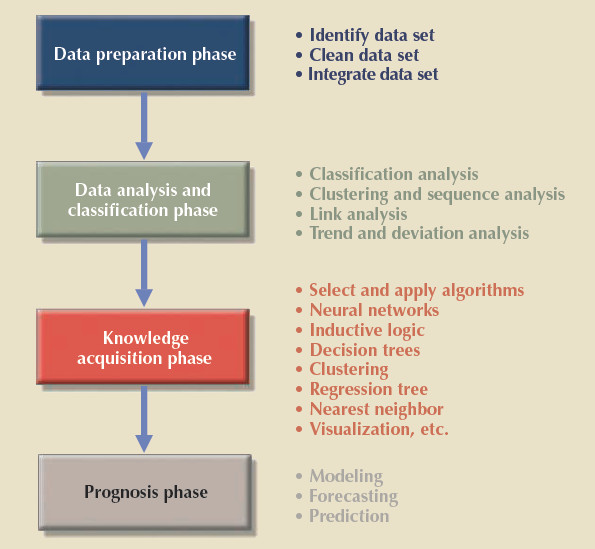
Despite the lack of precise standards, data mining consists of four general phases:
- Data preparation
- Data analysis and classification
- Knowledge acquisition
- Prognosis
Data Preparation
In the data preparation phase, the main data sets to be used by the data-mining operation are identified and cleansed of any data impurities.
- Data cleansing is the process of detecting and correcting or removing corrupt or inaccurate records from a record set, table, or database and may involve identifying incomplete, incorrect, inaccurate or irrelevant parts of the data and then replacing, modifying, or deleting the dirty or coarse data.
- Because the data in a data warehouse has already been integrated and filtered, the data warehouse is often used as the source for data-mining operations.
Data Analysis and Classification
The data analysis and classification phase studies the data to identify common data characteristics or patterns.
During this phase, the data-mining tool applies specific algorithms to find:
- Data groupings, classifications, clusters, or sequences
- Data dependencies, links, or relationships
- Data patterns, trends, and deviations
Knowledge Acquisition
The knowledge acquisition phase uses the results of the data analysis and classification phase.
During the knowledge acquisition phase, the data-mining tool (with possible intervention by the end user) selects the appropriate modeling or knowledge acquisition algorithms.
- The most common algorithms used in data mining are based on neural networks, decision trees, rules induction, genetic algorithms, classification and regression trees, memory-based reasoning, and nearest neighbor.
- A data-mining tool may use many of these algorithms in any combination to generate a computer model that reflects the behavior of the target data set.
Prognosis
In the prognosis phase, the data-mining findings are used to predict future behavior and forecast business outcomes.
Result
The complete set of findings can be represented in a decision tree, a neural network, a forecasting model, or a visual presentation interface that is used to project future events or results.
Data mining has proven helpful in finding practical relationships among data that help define customer buying patterns, improve product development and acceptance, reduce health care fraud, analyze stock markets, and so on.
Modes
Data mining can be run in two modes:
- Guided. The end user guides the data-mining tool step by step to explore and explain known patterns or relationships. In this mode, the end user decides what techniques to apply to the data.
- Automated. In this mode, the end user sets up the data-mining tool to run automatically and uncover hidden patterns, trends, and relationships. The data-mining tool applies multiple techniques to find significant relationships.
Summary
Data-mining methodologies focus on discovering and extracting information that describes and explains the data.
- For example, an explanatory model could create a customer profile that describes a given customer group.
Data mining can also be used as the basis to create advanced predictive data models.
- For example, a predictive model could be used to predict future customer behavior, such as a customer response to a target marketing campaign.
Section 7: Summary
Data analytics is the process of drawing insights from raw information sources.
It first requires inspecting, cleansing, transforming, and modeling data until it is in a form whereby it may be possible to discover useful information, inform conclusions, and support decision-making.
Data analytics involves the use of qualitative and quantitative techniques and processes to extract data and analyze and identify behavioral data and patterns.
More advanced approaches to data analytics include
- Predictive analytics, which seeks to predict customer behavior, equipment failures and other future events.
- Data mining, which involves sorting through large data sets to identify trends, patterns and relationships.
- Machine learning, which uses automated algorithms to churn through data sets more quickly than conventional analytical modeling.
Data analytics technologies like Hadoop, Spark, and Tableau are widely used in commercial industries to enable organizations to make more-informed business decisions and by scientists and researchers to verify or disprove scientific models, theories and hypotheses.