


Section 0: Module Objectives or Competencies
| Course Objective or Competency | Module Objectives or Competency |
|---|---|
| The student will be able to list and explain basic data warehouse concepts. | The student will be able to describe the data warehouse implementation steps, such as creating a data warehouse, the ETL process, developing data warehouse front-end applications, and data warehouse deployment. |
| The student will be able to explain how data warehouses are used. | |
| The student will be able to explain online analytical processing (OLAP). |
Section 1: Overview
Creating a data warehouse involves using the functionalities of database management software to implement the data warehouse model as a collection of physically created and mutually connected database tables.
- Quite often, data warehouses are modeled as relational databases, and as a consequence, they are implemented using a relational DBMS.
Creating a Data Warehouse
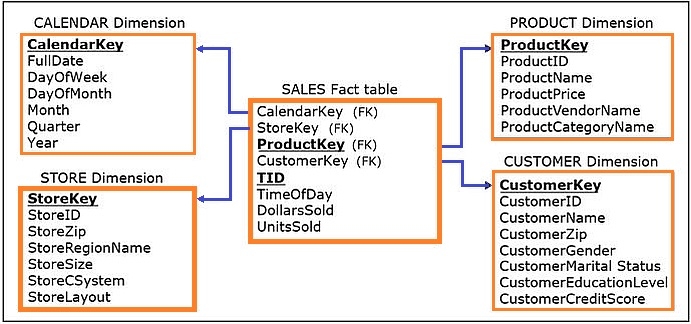
Assume we have the model for the data warehouse shown below:
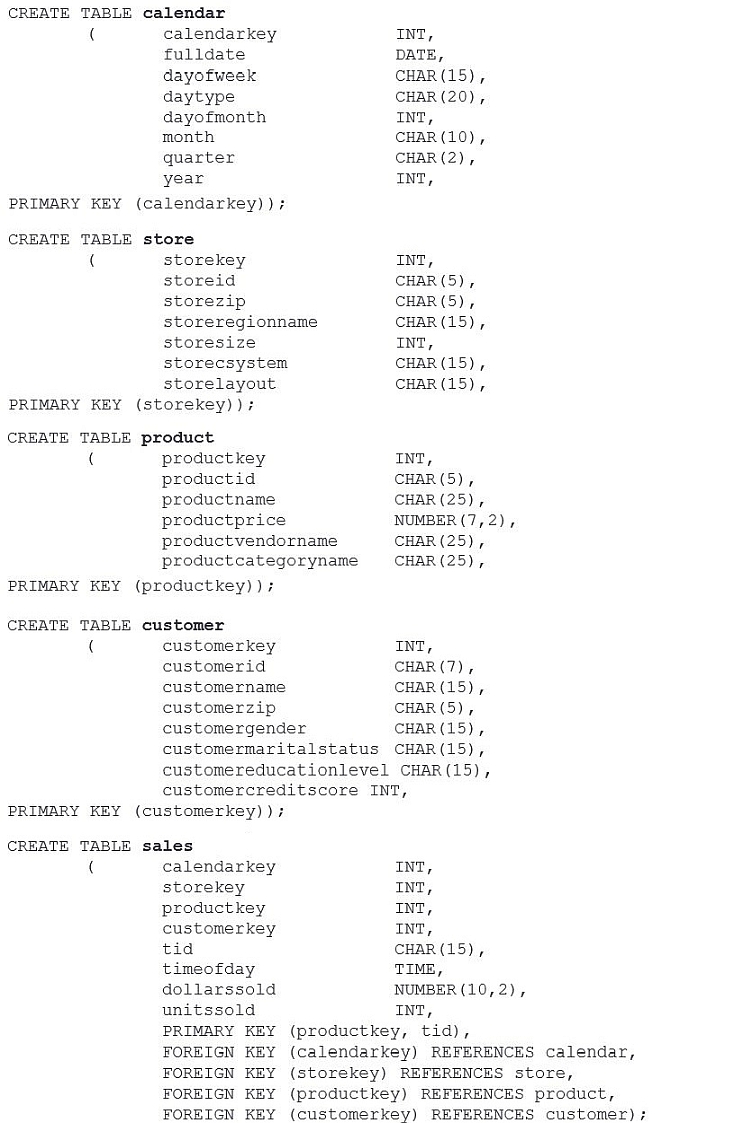
The CREATE TABLE statements for the model are shown below:
The created data warehouse tables are populated by the ETL infrastructure.
Section 2: ETL: Extraction, Transformation, Load
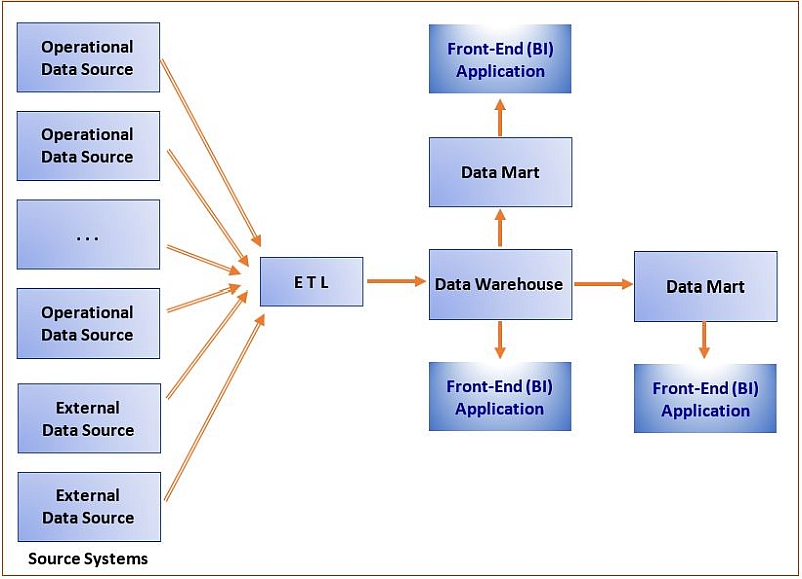
ETL (extraction, transformation, and load) involves a set of processes used to populate the data warehouse tables with the appropriate relevant data retrieved from the operational databases.
Here is an overview titled What is ETL?
In this example, the tables will be populated with the data from the following three data sources:
-
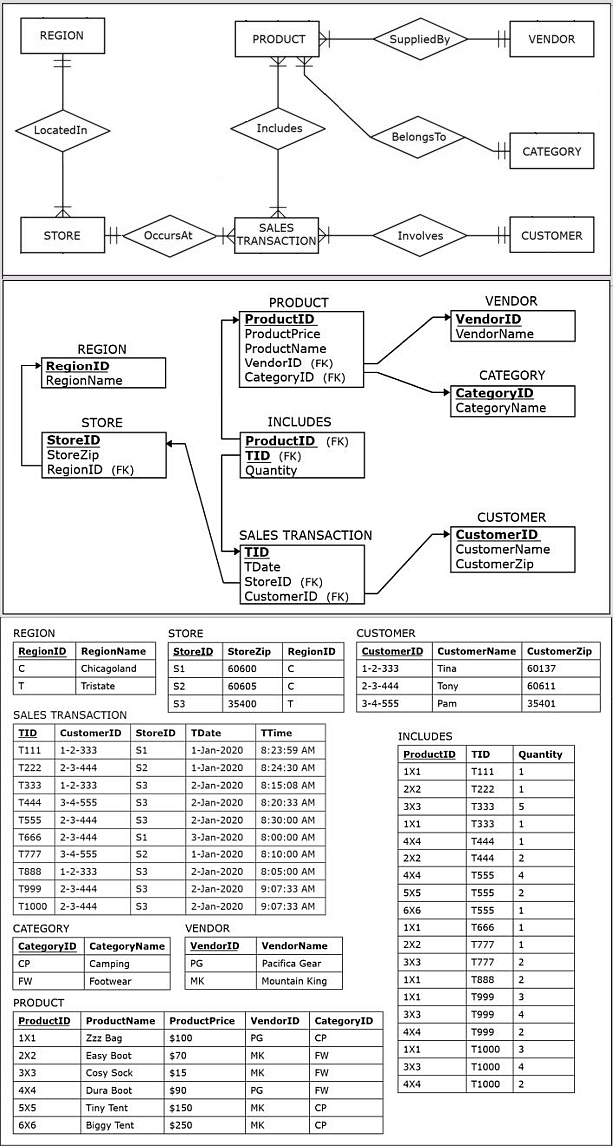
Source 1: The Sales Department database shown below:
-
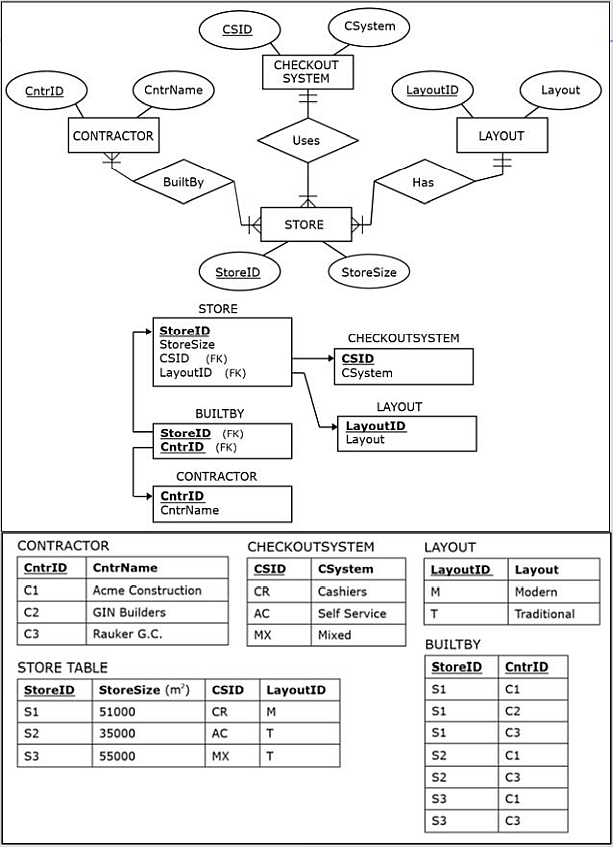
Source 2: The Facilities Department database shown here:
-
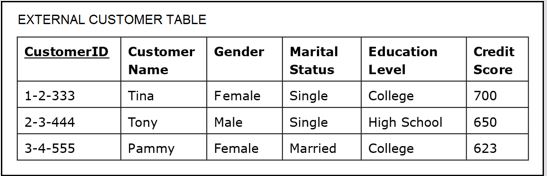
Source 3: The Customer Demographic Data external table shown below:
The ETL infrastructure will extract the data from the three sources, transform it, and load it into the data warehouse.
Extraction
Extraction refers to retrieving data from the operational data sources so that it can eventually be loaded into the data warehouse.
- The data to be extracted is data that has been deemed to be analytically useful in the data warehouse.
-
The issue of what to extract is dealt with in the requirements and modeling stages.
- These stages include the examination of the available sources of data.
- During the creation of the ETL infrastructure, the data model provides a blueprint for the extraction procedures.
- It is sometimes the case that in the process of creating the ETL infrastructure, the development team may realize that certain ETL actions should be done differently from what is prescribed by the given data model, and in such cases, the project will move iteratively back from the creation of the ETL infrastructure to the requirement stage.
All of the data from Sources 1 and 3 will be extracted, but only some of the data from Source 2 will be extracted.
Transformation
Transformation involves converting the structure of extracted data to conform to the structure of the target data warehouse model.
In the example, the transformation process follows these steps:
-
The records from the Source 1 CUSTOMER table in the Sales Department database are merged with the records from the Source 3 CUSTOMER table in the Customer Demographic Data external table.
- In other words, data about customers involved in sales transactions is merged with customers' demographic data.
- The surrogate key is added to each record, and data is transformed in such a way to fit the structure of the dimension CUSTOMER in the target data warehouse.
-
In addition to changing the structure of the extracted data, data quality control and improvement are included in the transformation process.
- Commonly, some of the data in the data sources exhibit data quality problems.
- Data sources often contain overlapping information.
- Data cleansing (scrubbing) is the detection and correction of low-quality data.
The uniqueness data quality problem arises because two tables from Source 1 contain records with duplicated data.
- The last displayed record in the SALESTRANSACTION table and the last three records in the INCLUDES table are a result of the uniqueness data quality problem.
- The data entry process in Source 1 incorrectly recorded the same transaction twice, using two different TID values (T999 and T1000).
- Both recorded transactions involve the same customer, store, and products and occurred on the same day at the exact same time.
- The data cleansing action that took place during the transformation process identified this uniqueness data quality problem and solved it by excluding the records with the TID value of T1000 from the set of extracted data.
- The non-unique data was filtered out, and did not end up in the SALES fact table in the data warehouse.
The process of transformation may involve standardizing different versions of the same data present in different data sources.
- It is very common to find separate operational databases with overlapping information.
In this example, both the Source 1 and Source 2 databases have overlapping information about stores (Store ID and Store Zip).
- Fortunately, this information is recorded in the exact same fashion in Sources 1 and 2.
- However, Source 1 and Source 3 contain an instance of overlapping information about customers that is not recorded in the same fashion.
- In particular, the customer whose ID is 3-4-555 in table CUSTOMER in Source 1 has her name recorded as Pam. That same customer in table CUSTOMER in Source 3 has her name recorded as Pammy.
- The transformation process has been coded in such a way that it recognizes that these are both variations of the same name belonging to the same person and chooses one of them to be used in the dimension CUSTOMER.
Another type of activity that is part of the transformation process is deciding on and implementing slowly changing dimensions policies, for columns that are subject to changes.
There are two major kind of transformations: active transformations and passive transformations.
-
Active transformations
- Produce a different number of rows in the output data as compared to the incoming data extracted from sources.
-
Reasons for active transformations that change the number of rows include:
- quality issues, such as dealing with the uniqueness problem
- creating aggregated fact tables from the detailed fact tables (where aggregated tables aggregate the rows from detailed fact tables and end up having a reduced number of rows)
- implementing Type 2 slowly changing dimensions approach (where every change in the dimension column value creates a new row, thereby increasing the number of rows)
-
Passive transformations
- Do not affect the number of rows, and incoming and outgoing rows have same counts.
-
Reasons for passive transformations that do not affect the number of rows include:
- generating surrogate keys for dimensions
- creating stored derived attributes
Load
Load involves storing the extracted, transformed, and quality-assured data into the target data warehouse.
- A load typically involves a batch process that inserts the data into the data warehouse tables in an automatic fashion without user involvement.
-
The initial load (first load), populates initially empty data warehouse tables.
- It can involve large amounts of data, depending on what is the desired time horizon of the data in the newly initiated data warehouse.
- Any necessary archived data will be loaded into the data warehouse during this load.
- Every subsequent load is referred to as a refresh load.
-
Refresh cycle is the period in which the data warehouse is reloaded with the new data (e.g. hourly, daily).
- Determined in advance, based on the analytical needs of the business users of the data warehouse and the technical feasibility of the system.
- In active data warehouses the loads occur in micro batches that occur continuously.
ETL Infrastructure
The ETL processes are facilitated by the ETL infrastructure.
- Typically, the process of creating the ETL infrastructure includes using specialized ETL software tools (such as IBM Infosphere Warehouse Edition, PowerCenter Informatica, Oracle Data Integrator, or Cognos Data Manager) and/or writing specialized scripts.
- Due to the amount of detail that has to be considered, creating the ETL infrastructure is often the most time- and resource-consuming part of the data warehouse development process.
- The ETL infrastructure creation process is essentially dictated by the results of the requirements collection and modeling processes.
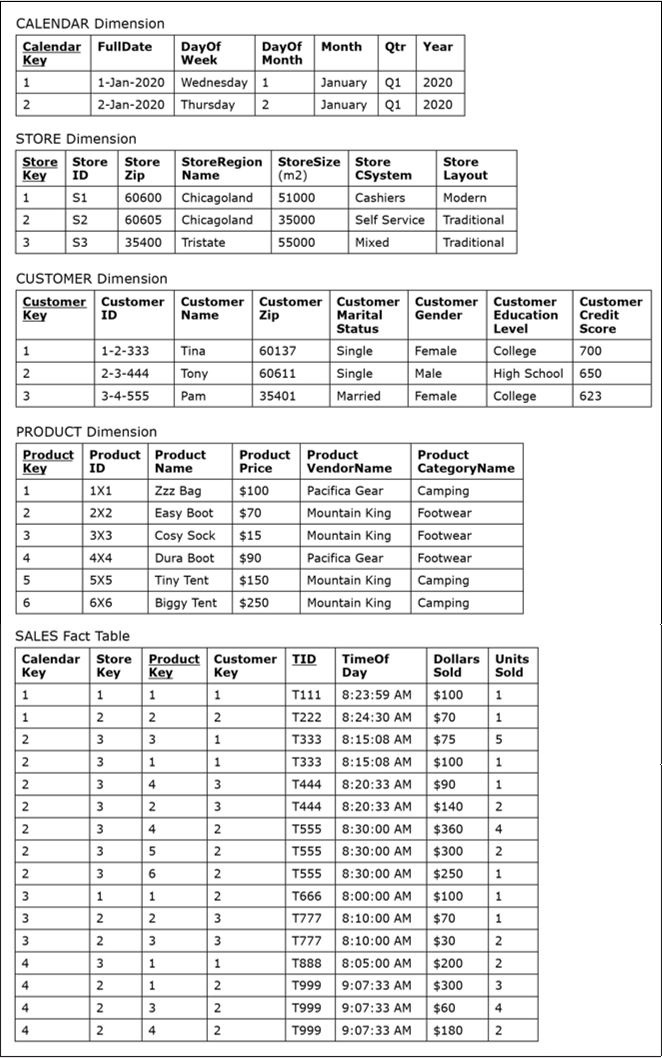
In the example, the result of the ETL process is the populated data warehouse as shown below.
Section 3: Online Analytical Processing (OLAP)
Online analytical processing (OLAP) refers to querying and presenting data from data warehouses for analytical purposes.
The correlation of OLAP in operational databases is online transaction processing (OLTP).
- OLTP refers to updating (i.e., inserting, modifying, and deleting), querying, and presenting data from databases for operational purposes.
Comparison
- OLTP systems are capable of updating, querying, and presenting data, whereas OLAP tools can only engage in querying and presenting data.
- While OLTP systems routinely perform transactions that insert, modify, and delete data from databases, OLAP tools are read only.
- OLAP tools are used exclusively for the retrieval of data from analytical repositories to be used in the decision-making process.
- Users of OLAP tools can quickly read and interpret data that is gathered and structured specifically for analysis and subsequently make fact-based decisions.
Section 4: OLAP/BI Tools
BI Tools Overview (link no longer available on YouTube)
The data in a data warehouse can be accessed directly by the users via SQL or, more commonly, via OLAP tools, also known as business intelligence (BI) tools.
- OLAP/BI tools are designed for the analysis of dimensionally modeled data.
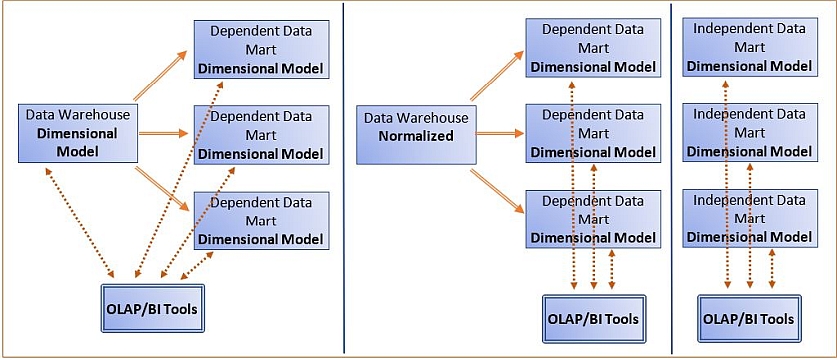
- Regardless of which data warehousing approach is chosen, the data that is accessible to the end user is typically structured as a dimensional model.
-
OLAP/BI tools can be used on analytical data stores created with different modeling approaches, as illustrated below:
Section 5: OLAP/BI Tools Interface
There are numerous OLAP/BI tools (by vendors such as Tableau, Splunk, Domo, IBM Cognos, Apache Kylin, SAP BusinessObject, Oracle BI, or Qlik) available in the marketplace today, and the following is an overview of functionalities that are common for all OLAP/BI tools.
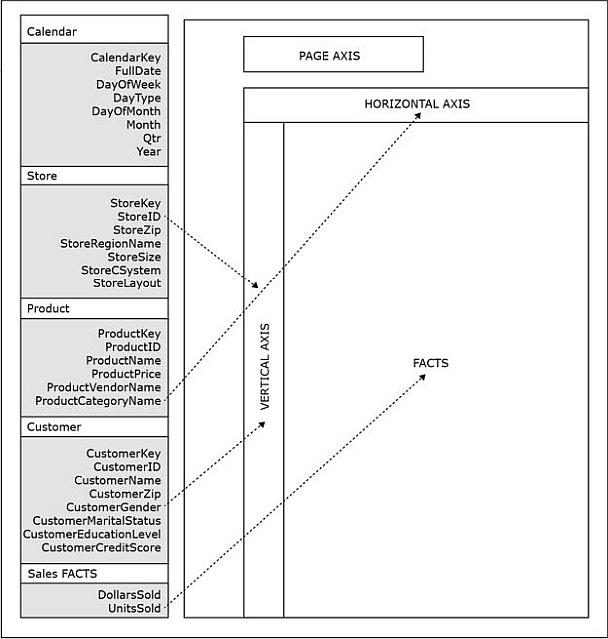
An OLAP/BI tool interface, with a layout similar to the figure below, might be used to analyze various facts across all attributes of all dimensions in the data warehouse.
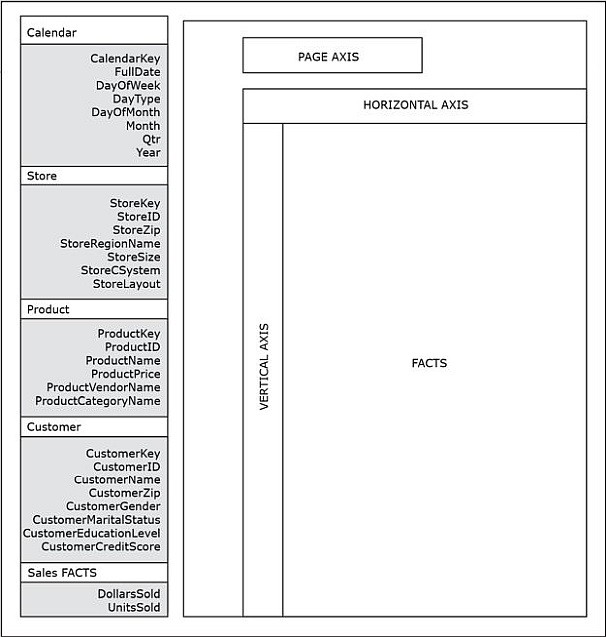
The user could specify any of the particular queries analyzing DollarsSold and/or UnitsSold across the dimensions by simply choosing the attributes needed for the query via the drag-and-drop method.
- To implement a query in an OLAP/BI tool, the user drags the attributes needed for the query from the part of the graphical interface representing the schema and drops them on the part of the graphical interface representing the query construction space.
- The query construction space in a typical OLAP/BI tool contains the vertical, horizontal, and page axes, as well as the area for facts.
- By dragging a dimension attribute to a vertical axis, the user specifies that results referring to that dimension attribute will be put in rows.
- By dragging a dimension attribute to a horizontal axis, the user specifies that results referring to that dimension attribute will be put in columns.
- Most OLAP/BI tools feature a page axis, an additional axis that can be used during pivot operations.
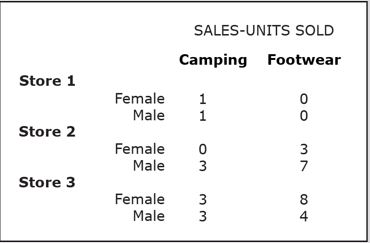
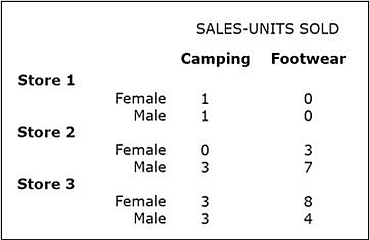
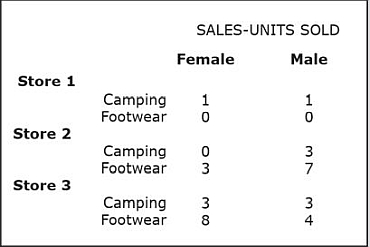
In the following scenario, an OLAP/BI tool will be used to analyze the DollarsSold and UnitsSold sales facts across all attributes of all dimensions in the data warehouse to address the following query.
- OLAP Query I: For each individual store, show separately for male and female shoppers the number of product units sold for each product category.
To address OLAP Query 1,
- The user drags StoreID and Gender to the vertical axis, and Category to the horizontal axis, and then
- drags the attribute UnitsSold (from the SALES fact table) into the fact area of the query construction space.
-
This is illustrated below:
Once the query is constructed, and then executed, results like the following will be shown on screen.
When a query has displayed the results, the user has the option to perform any of the three basic OLAP operations: slice and dice, pivot (rotate), and drill-down or roll-up, as discussed in the next section.
Additional OLAP/BI Tools Functionality Note
The dimensional model is essential for OLAP.
- The underlying data must be organized dimensionally, with a fact table in the center connected to a number of dimension tables, otherwise the three basic OLAP operations could not be performed effectively or properly.
-
Additional OLAP/BI Tool functionalities:
- Graphically visualizing answers
- Creating and examining calculated data
- Determining comparative or relative differences
- Performing exception analysis, trend analysis, forecasting, and regression analysis
- Number of other analytical functions
- Many OLAP/BI tools are web-based.
Section 6: OLAP/BI Tools Operations
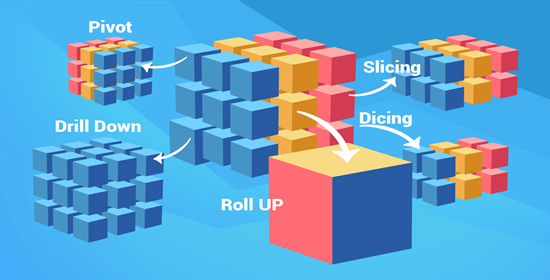
Three basic OLAP/BI tool features regularly used by analysts include:
-
Slice and Dice (It slices! It dices!)
- Adds, replaces, or eliminates specified dimension attributes (or particular values of the dimension attributes) from the already displayed result.
-
Slicing and dicing refers to a way of segmenting, viewing and comprehending data in a database.
-
Slice is the act of picking a flat rectangular subset of a cube by choosing a single value for one of its dimensions, creating a new cube with fewer dimensions.
- Phrased a bit differently, slicing produces a new data cube with one fewer dimension by locking on a single value of that dimension.
-
Dicing selects two or more dimensions from a given cube and provides a new sub-cube.
- Dicing produces that new data cube by selecting specific values of various dimensions.
- Large blocks of data are cut into smaller segments and the process is repeated until the correct level of detail is achieved for proper analysis.
- Hence, slicing and dicing presents the data in new and diverse perspectives and provides a closer view of it for analysis.
-
Slicing is an OLAP feature that allows taking out a portion of the OLAP cube to view specific data.
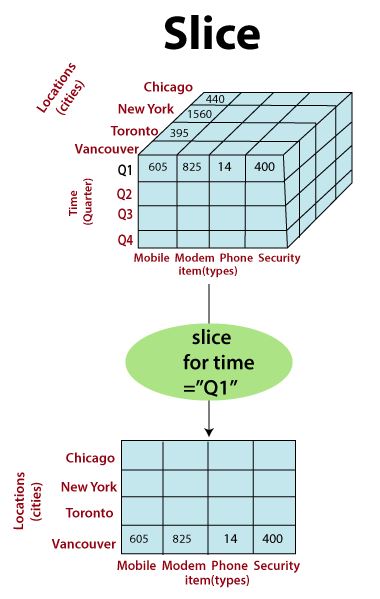
- In the above diagram, the cube is sliced to a two-dimensional view showing Item (types) with respect to Location (cities), while skipping the time dimension.
-
In dicing, users can analyze data from different viewpoints.
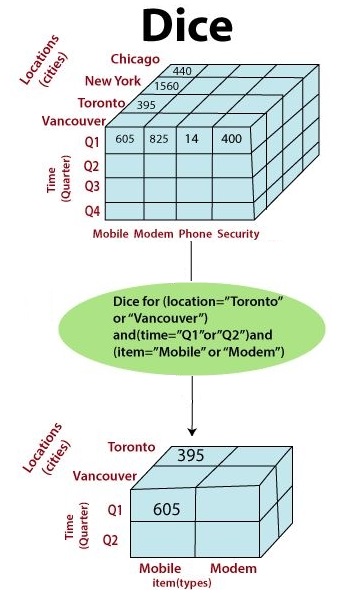
- Dice is the act of producing a sub-cube by allowing the analyst to pick specific values of multiple dimensions.
- In the above diagram, the users create a sub-cube and choose to view data for two Item types and two locations in two quadrants.
-
See Slicing and Dicing.
The main difference between slice and dice in data warehouse is that the slice is an operation that selects one specific dimension from a given data cube and provides a new sub-cube, while the dice is an operation that selects two or more dimensions from a given data cube and provides a new sub-cube.
-
Slice is the act of picking a flat rectangular subset of a cube by choosing a single value for one of its dimensions, creating a new cube with fewer dimensions.
-
Pivot (Rotation)
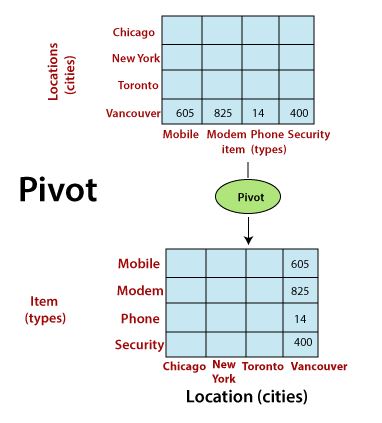
- Reorganizes the values displayed in the original query result by moving values of a dimension column from one axis to another.
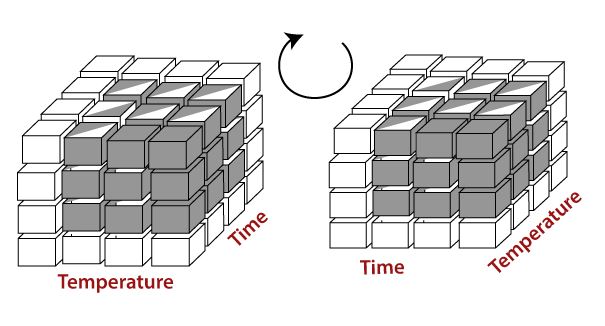
- Pivot is a visualization operation that rotates the data axes to provide an alternative presentation of the data.
- It may involve swapping the rows and columns or moving one of the row-dimensions into the column dimensions.
-
Drill-down and Drill-up (Roll-up)
-
Drill-down
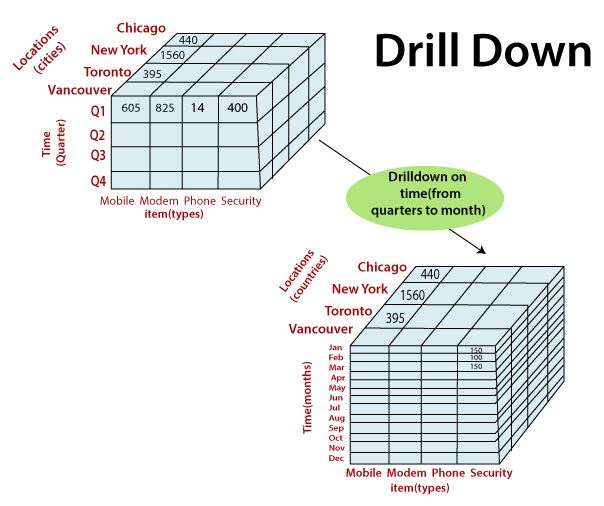
- Drill-down refers to the process of viewing data at a level of increased detail, i.e., it makes the granularity of the data in the query result finer.
- Drill-down helps users navigate through the data details.
- In the above example, drilling down enables users to analyze data in the three months of the first quarter separately, by dividing the data with respect to cities, months (time) and item (type).
-
Drill-up (also called Roll-up)
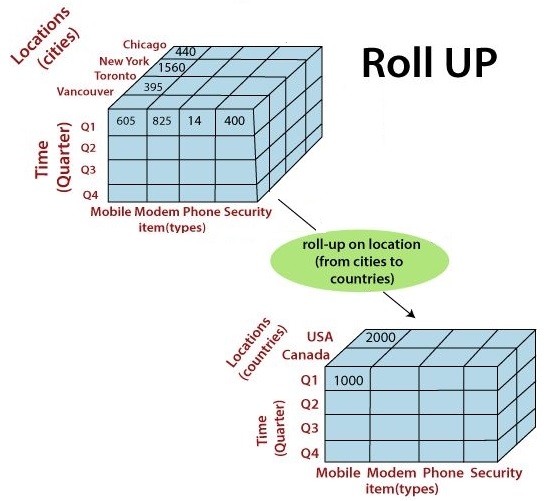
- Roll-up refers to the process of viewing data with decreasing detail, i.e., it makes the granularity of the data in the query result coarser.
- Roll-up or consolidation refers to data aggregation and computation in one or more dimensions.
- For instance, the diagram above shows a cube with cities rolled up to countries to depict the data with respect to time (in quarters) and item (type).
-
Drill hierarchy
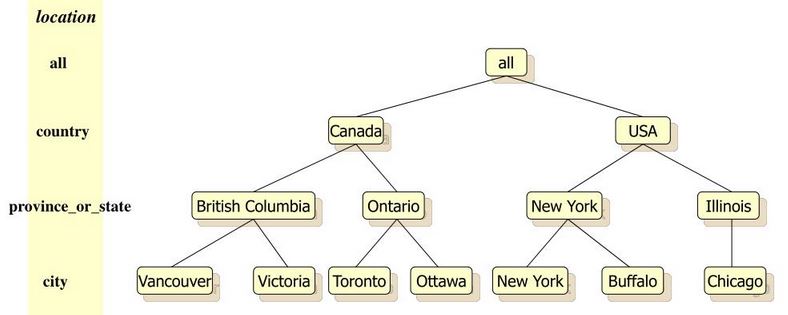
A drill hierarchy, or concept hierarchy, defines a sequence of mappings from a set of low-level to higher-level concepts.
-
Some dimensions can have multiple levels forming a hierarchy.
- For example, dates have year, month, day; geography has country, region, city; product might have category, subcategory and the product.
- A drill hierarchy is a set of attributes within a dimension where an attribute is related to one or more attributes at a lower level but only related to one item at a higher level, such as StoreRegionName ⇒ StoreZip ⇒ StoreID.
- Used for drill-down/roll-up operations.
-
Some dimensions can have multiple levels forming a hierarchy.
-
Drill-down
Here are some links that provide greater detail about the above operations:
- OLAP Operations in Data Mining
- OLAP Operations in DBMS
- What is OLAP? Cube, Operations & Types in Data Warehouse
Slice and Dice
Recall that the slice and dice operation adds, replaces, or eliminates specified dimension attributes (or particular values of the dimension attributes) from the already displayed result.
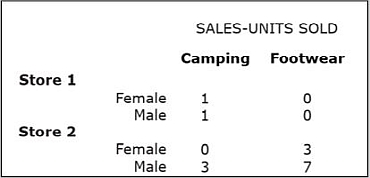
The query could be modified so that only the results for stores 1 and 2 are displayed, that is, the results showing sales in store 3 will be "sliced out" from the original query.
The modified query is specified as follows:
- OLAP Query 2: For stores 1 and 2, show separately for male and female shoppers the number of product units sold for each product category.
The next figure shows the result of OLAP Query 2, created by performing a slice and dice operation on the OLAP Query 1.
In addition to eliminating dimension attributes or selected values of dimension attributes, a slice and dice operation can replace or add dimension attributes.
This can be illustrated by modifying the OLAP Query 1 by replacing the ProductCategory attribute from the PRODUCT dimension with the DayType attribute from the CALENDAR dimension.
The wording of the modified query is as follows:
- OLAP Query 3: For each individual store, show separately for male and female shoppers the number of product units sold on workdays and on weekends/holidays.
Here is the result of OLAP Query 3, created by performing another slice and dice operation on OLAP Query 1.
Pivot (Rotate)
Unlike the slice and dice operation, the pivot (rotate) operation does not change the values displayed in the original query, it simply reorganizes them.
The following example of a pivot operation uses OLAP Query 1 as a starting point and then simply swaps the axes for the ProductCategory attribute and the StoreID attribute.
The result of this pivot action is shown below:
Because the pivot action does not change the values shown to the user, the wording for the query is not modified.
In the original query, ProductCategory was placed on the horizontal axis and CustomerGender was placed on the vertical axis, but in this version, the pivoting action was performed and ProductCategory was rotated onto the vertical axis, whereas CustomerGender was moved to the horizontal axis.
The page axis can be used in pivot operations to view the table per single value of the attribute placed in the page axis.
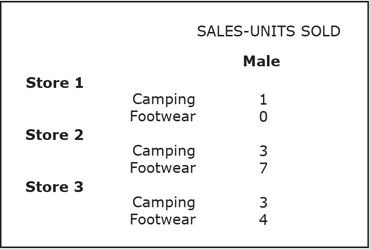
This figure below shows the result of pivoting the CustomerGender attribute from the horizontal axis to the page axis, using OLAP Query 1.
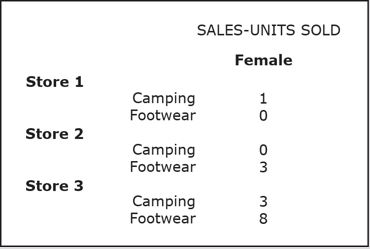
In this case, the table shows the sales in different stores per product category for Female shoppers only.
Users can easily switch from one value of the attribute (Female, as shown above) to another value of the attribute (Male, as shown below) by using a point-and-click menu mechanism that usually accompanies the page axis feature in a typical OLAP/BI tool.
Drill-Down and Roll-Up
The purpose of the drill-down operation is to make the granularity of the data in the query result finer; in the case of roll-up, it is to make it coarser.
The drill-down operation allows users to drill through hierarchies within dimensions.
A hierarchy is a set of attributes within a dimension where an attribute is related to one or more attributes at a lower level but only related to one item at a higher level.
- For example, ProductName, and ProductCategory are in a hierarchy because each ProductName belongs to one ProductCategory, while each ProductCategory can have more than one ProductName.
-
For another example of a hierarchy, consider the following attributes in the Store dimension: StoreID, StoreZip, and StoreRegionName.
-
These three attributes form the hierarchy StoreRegionName ⇒ StoreZip ⇒ StoreID because of the following:
- One StoreID has one StoreZip and one StoreRegionName.
- One StoreZip has one StoreRegionName but can have many StoreID values.
- One StoreRegionName can have many StoreZip values and subsequently even more StoreID values.
- Multiple stores can exist in the same zip code, and multiple zip codes can exist in the same region.
- Each zip code belongs to one region and each store has one zip code and, therefore, belongs to one region.
- Thus, sales in the zip codes can be expanded to show sales in individual stores (drill-down) or merged into sales within regions (roll-up).
-
These three attributes form the hierarchy StoreRegionName ⇒ StoreZip ⇒ StoreID because of the following:
-
Some dimensions, such as the STORE dimension, can have more than one hierarchy.
- StoreRegionName ⇒ StoreZip ⇒ StoreID
- StoreSize ⇒ StoreID
- StoreCSystem ⇒ StoreID
- StoreLayout ⇒ StoreID
- The hierarchies described above are also known as drill hierarchies, because they allow the user to expand a value at one level to show the details below it (drill-down), or collapse the details to show only the higher-level values (roll-up).
The following example uses the OLAP Query 1 result as a starting point and then drills down in the PRODUCT dimension from ProductCategory to ProductName.
The wording of the query is expanded in the following way:
- OLAP Query 4: For each individual store, show separately for male and female shoppers the number of product units sold for each individual product in each product category.
The following figure shows the result of OLAP Query 4, created by performing a drill-down operation on the OLAP Query 1 result.
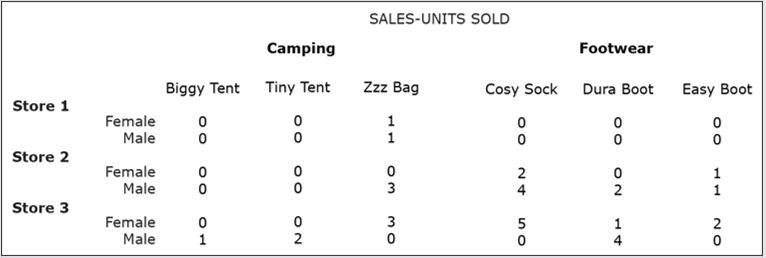
Conversely, to illustrate the roll-up operation, consider the recent query results as starting query and the OLAP Query 1 result as the product of a roll-up operation from ProductName to ProductCategory.
Video Supplements
Section 7: Front-End Applications
OLAP/BI Tools have two purposes:
- Ad hoc direct analysis of dimensionally modeled data
- Creation of front-end (BI) applications
Data Warehouse Front-End (BI) Applications provide access for indirect use.
- The data warehouse front-end applications are collections of predeveloped queries organized for simple access, navigation, and use by the end user.
- Developing front-end applications includes creating the set of predeveloped queries and the interfaces for those queries.
- The process of developing front-end applications can incorporate the use of OLAP/BI tools, other reporting tools, or writing code from scratch.
- Most OLAP/BI tools include functionalities for creating front-end interfaces.
- Just as with the OLAP/BI tools, access to front-end applications can also be web-based.
Section 8: Data Warehouse Deployment
Data warehouse deployment refers to allowing the end user access to the newly created and populated data warehouse and to its front-end applications.
- Typically, the deployment does not occur all at once for the entire population of intended end users, rather, the deployment process is more gradual.
Like most other information systems, the data warehousing system often goes through a testing phase before it is fully deployed to all of its users, with the feedback from the testing phases leading to modifications to the system prior to the actual deployment of a functioning data warehousing system.
- Alpha release - Internal deployment of a system to the members of the development team for initial testing of its functionalities.
- Beta release - Deployment of a system to a selected group of users to test the usability of the system.
- Production release - The actual deployment of a functioning data warehousing system.
Once the data warehousing system is deployed, the end user can start using it for the tasks that require data from the data warehouse.
Section 9: Resources
-
ETL and Data Warehousing
-
SQL Best Practices - Designing An ETL - Part 1
- What Is ETL And How the ETL process works?
- ETL Basics: Extract, Transform & Load
- ETL & Data Warehousing Explained: ETL Tool Basics
- A Beginner’s Guide to Data Engineering — Part I
- A Beginner’s Guide to Data Engineering — Part II
- A Beginner’s Guide to Data Engineering — The Series Finale