


Section 0: Module Objectives or Competencies
| Course Objective or Competency | Module Objectives or Competency |
|---|---|
| The student will develop the analytical skills required to examine a situation in order to thoroughly understand the factors involved, to recognize any problems, and to derive potential solutions. | Students will gain experience developing data flow diagrams (DFDs), including the context diagram, diagram 0, more detailed DFD levels. |
| Students will learn how to choose the level of details for DFD depending on the type of implementation team. | |
| The student will experience developing both logical and physical DFDs, and when each is appropriate. | |
| The student will experience partitioning DFDs in order to modularize a system prior to implementation. | |
| The student will experience how to use DFDs as a both documentation and as a communication tool. | |
| The student will be able to use their analytical skills to analyze system requirements and specify system processes and data flows, express requirements through various approaches, and develop that component of a Problem Specification. | The student will apply the analytical skills learned in analyzing the requirements specification and transforming those requirements into a DFD in order to develop that component of the Problem Specification. |
Section 1: Overview
Process models graphically represent the processes that capture, manipulate, store, and distribute data between a system and its environment and among system components.
- Information gathered during requirements determination.
- Details of the requirements specification were used to develop the functional decomposition.
- Processes and data structures are modeled using the functional decomposition as a basis.
Section 2: Data Flow Diagrams
Data Flow Diagrams (DFDs), in combination with state diagrams (not covered in this section), process specifications and a data dictionary make up the components of structured analysis.
Data Flow Diagrams
- The DFD is one of the main methods available for analyzing process-oriented systems
- DFDs graphically characterize data processes and flows in a business system
- DFDs depict an overview of system inputs, processes, and outputs
- DFDs are useful for depicting purely logical information flows; emphasize the logic underlying the system
- a series of layered DFDs show an increasing level of detail and can be used to represent and analyze detailed procedures within the system
- Using DFDs helps to develop functional model of system, that is, a graphical representation of data movement through the organization. (Interactive Example)
-
Example Data Flow Diagram
Benefits
- helps to understand how data moves through an organization
- helps to understand processes and transformations that the data undergoes
- shows what the outputs are
- provides visual depiction, or graphical representation
- emphasizes the logic underlying the system
Advantages of Graphical Depiction over narrative explanations of data movement
- Emphasizes the interrelationships of systems and subsystems.
- Communicates current system knowledge to users; allow analysts to describe each component used in the diagram.
- Can also be used to analyze the proposed system to determine if the necessary data and processes have been defined.
- Freedom from committing to the technical implementation too early; does not require specification of physical aspects.
Section 3: Symbols
Video Explanation
Let's start with a video: Data Flow Diagram (DFD)
Let's see another video: How to Draw Data Flow Diagram?
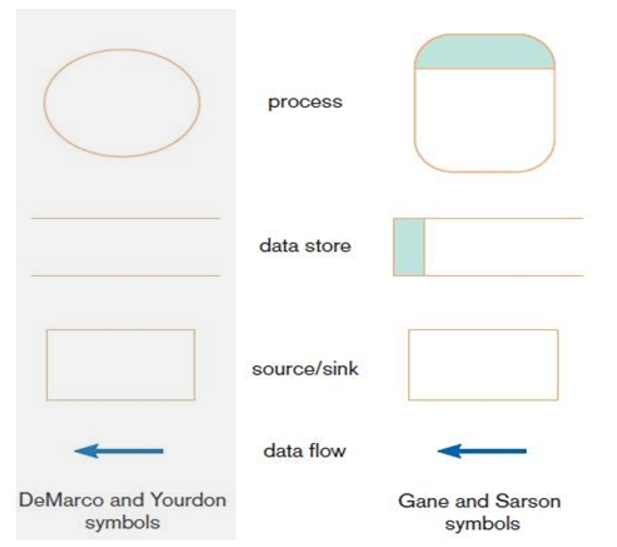
Comparison of DeMarco and Yourdon vs. Gane and Sarson DFD symbol sets
Process or Transform
-
 Circle or Rounded-edged rectangle
- May represent either an entire system, a subsystem, or an
activity
- An activity is work or actions performed on data (inside the system)
- Denotes a change in or transformation of data
- A data flow leaving a process is ALWAYS labeled differently from the one entering it
- A process may have multiple data flows in and out
- Assigned a unique identifying number indicating level of diagram
- Naming convention:
- Assign the name of the whole system when naming a high-level process.
- To indicate a major subsystem you may attach the word "subsystem" to the name.
- Use the form verb-adjective-noun for detailed processes.
Data Store
-
 Open-ended rectangle or side-less rectangle
- Shows a repository of data that allows addition and retrieval of data (database, computerized file, filing cabinet)
- Data at rest (inside the system)
- Required between processes if they share data
- used to synchronize processes (if output not immediately needed by next process)
- Data stores are usually given a unique reference number, such as D1, D2, D3
- Naming convention:
- Named with a noun, describing the data
Source/sink (external entity)
-
 A rectangle
- Also known as entity or origin/destination
- External entity that is an origin or destination of data
(outside the system)
- Shows the initial source and final recipient of data and information
- Can send data to or receive data from the system
- External to the study and outside of the boundaries of the system
- Represents another department, a business, a person, or a
system outside of the system being studied
- Another department within the company, such as ORDER FULFILLMENT
- A company or organization, such as BANK or SUPPLIER
- A person, such as CUSTOMER or STUDENT
- Another system or subsystem, such as the INVENTORY CONTROL SYSTEM
- Naming convention:
- Should be named with a noun, describing that entity
Data Flow
-
 An arrow
- Shows movement of data from one point to another
- data about a person, place, or thing that moves through the system
- Arrowhead indicates the flow direction (data's destination)
- Simultaneous flows depicted through use of parallel arrows
- Use double headed-arrows only when a process is reading data and updating the data on the same table or file
- Naming convention:
- Names should be a noun that describes the data moving through the system
Section 4: Developing Data Flow Diagrams
Current System
-
First analyze the current system, and then add features that
the new system should include.
- Use this as the basis for the logical DFD for the new system.
- Unnecessary processes can be dropped, and new ones added.
- Ensures that essential features of the old system are retained.
- Provides for gradual transition of design to the new system.
-
Advantages:
- better communication with users
- more stable systems
- better understanding of the business by analysts
- flexibility and maintenance
- elimination of redundancies and easier creation of the physical model
Developing Data Flow Diagrams
Data flow diagrams are built in layers using the following guidelines:
- The top level is the context level diagram, which includes all external entities and the major data flows to or from them.
- Create Diagram 0 (also called Level 0) by analyzing the major
activities within the context process.
- Include the external entities and major data stores.
- Create a child diagram for each complex process on Diagram 0 by exploding (expanding upon) each process, introducing subprocesses that fill in the details about data movement and how that data is transformed.
- The lower level diagram number is the same as the parent process number.
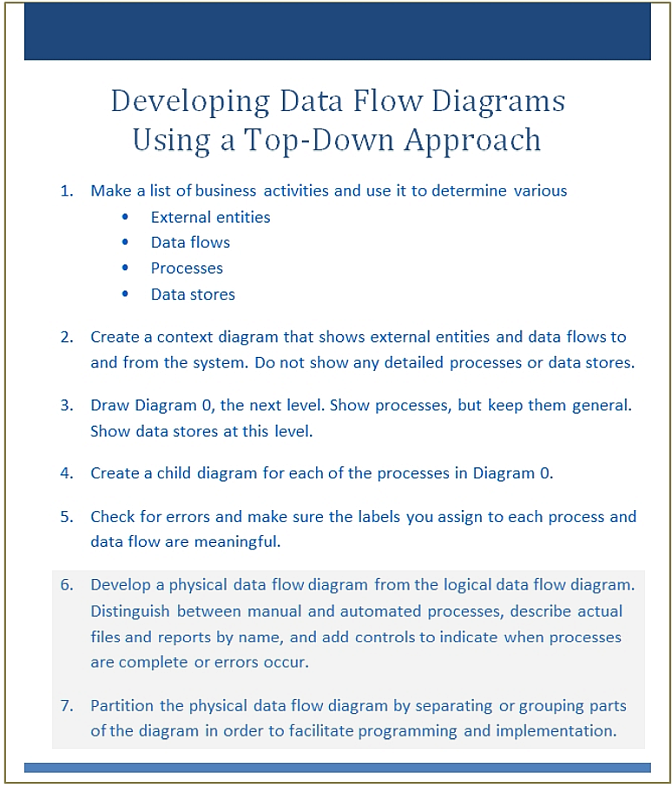
Developing Data Flow Diagrams Using a Top-Down Approach
Section 5: Context Diagram
- Context diagram is an overview of an organizational system that
shows:
- the system boundaries.
- external entities that interact with the system.
- major information flows between the entities and the system.
- Highest level in a DFD
- Contains only one process that represents the entire system and does not contain any data stores
- The process is given the number 0
- All external entities are shown on context diagram, as well as all major flows to and from them
- Establishes boundary between system and external environment
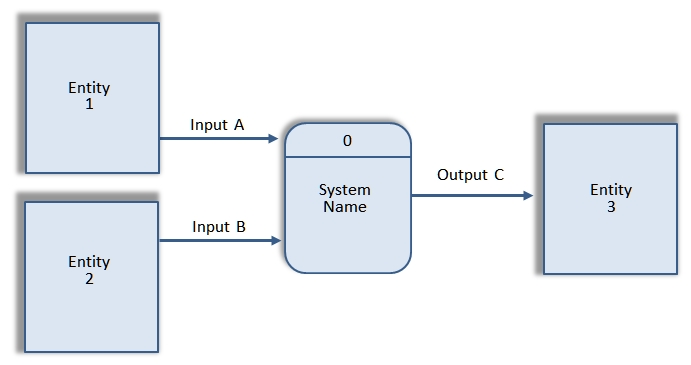
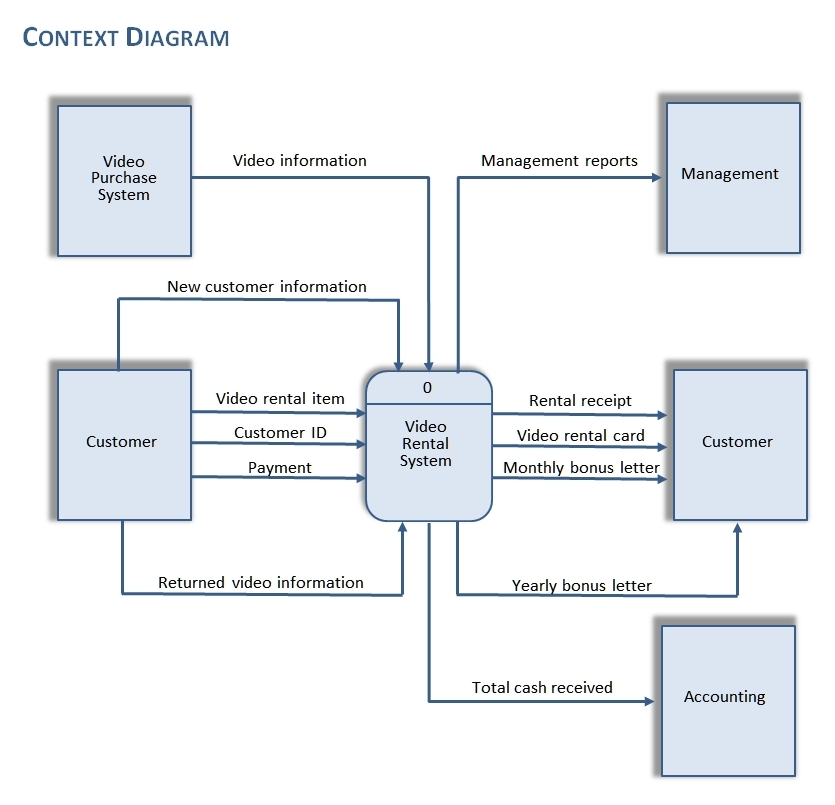
Generic Context Diagram

Example Context Diagram
Section 6: Diagram 0
Diagram 0 is an explosion of the context diagram, which means that it provides a detailed depiction of the context diagram. It represents a system’s major processes, data flows, and data stores at a high level of detail.
- The major data stores and all external entities are included on Diagram 0.
- Since external entities are external to the system, they should be placed close to the periphery of the diagram.
- External entities can appear on a diagram more than once to avoid crossing data flow lines.
- Processes are labeled 1.0, 2.0, etc. These will be decomposed
into more primitive (lower-level) DFDs.
- Exploding DFDs into sub processes fills in details about data movement and transformation.
- Process names must be a verb followed by a noun or object, like Finalize Paper.
- Use the form verb-adjective-noun for detailed processes.
- Data flows, data stores, and entity names must be a noun or noun phrase.
- Two different flows cannot have same label.
- Inputs and outputs specified in context level remain constant in this and all subsequent diagrams.
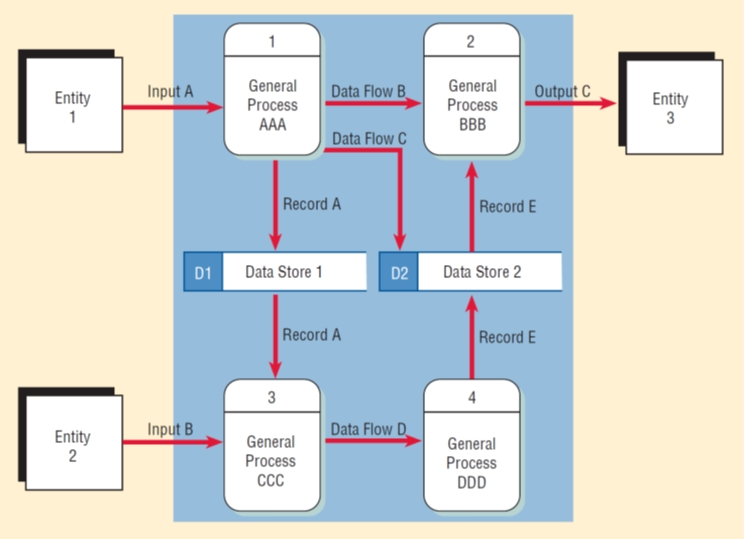
Generic Diagram 0

Example Diagram 0
Section 7: More Detailed DFD Levels
Child Diagrams
- A level-1 diagram results from the decomposition of the level-0 diagram, or Diagram 0.
- A level-n diagram is a DFD diagram that is the result of n nested decompositions from a process on a level-0 diagram.
Here's a video that explains the process: What is a Data Flow Diagram and Why Do You Need One?
And another: Data Flow Diagram
- Data flow diagrams are built in layers.
- You will recall that functional decomposition is an iterative process of breaking a system description down into finer and finer detail.
- Creates a set of charts in which one process on a given chart is explained in greater detail on another chart.
- The top level is the context level.
- Each process may explode to a lower level.
- Continues until no subprocess can logically be broken down any further.
- Processes that do not create a child diagram are called
primitive (or functionally primitive).
- Logic (process specifications) and/or textual descriptions are written for functional primitives.
Creating Child Diagrams
- Each process on diagram zero may be exploded to create a
child diagram.
- Each process on a lower-level diagram may be exploded to create another child diagram.
- Entities:
- External entities are usually not shown on child diagrams below Diagram 0 – but I recommend it for the sake of clarity.
- Data Stores:
- If the parent process has data flow connecting to a data store, the child diagram may include the data store as well.
- A lower-level diagram may contain data stores not
shown on the parent process, such as
- A file containing a table of information (such as a tax table)
- A file linking two processes on the child diagram
- Data Flows:
-
A child diagram cannot produce output or receive input
that the parent process does not also produce or receive.
This is referred to as vertical balancing.
- This means that a flow shown on a child diagram must also appear on the parent diagram, with the same name.
- An interface data flow is data that are input or output
from a child diagram that matches the parent diagram data flow.
- A data flow that matches the parent flow is shown as an arrow from or into a blank area of the child diagram; the source or destination of such flows must be labeled clearly.
- A minor data flow, such as an error line, may be included on a child diagram.
-
A child diagram cannot produce output or receive input
that the parent process does not also produce or receive.
This is referred to as vertical balancing.
Lower Levels
- Level-1 diagram results from decomposition of Level-0 diagram.
- Level-n diagram is a DFD diagram that is the result of n nested decompositions from a process on a level-0 diagram.
Numbering
-
The diagram number of the child diagram must be the same as the
process number of the parent process.
- Process 3 on Diagram 0 (or Level 0) would explode to Level 1 Diagram 3.
-
Processes on the child diagram are numbered using the diagram
number, a decimal point, and a unique number for each child
process.
- To continue the example above, the processes on Level 1 Diagram 3 would be numbered 3.1, 3.2, 3.3 and so on.
- If process 3.1 on Level 1 Diagram 3 was decomposed, the diagram would be Level 2 Diagram 3.1, and its processes would be numbered 3.1.1, 3.1.2, 3.1.3, etc.
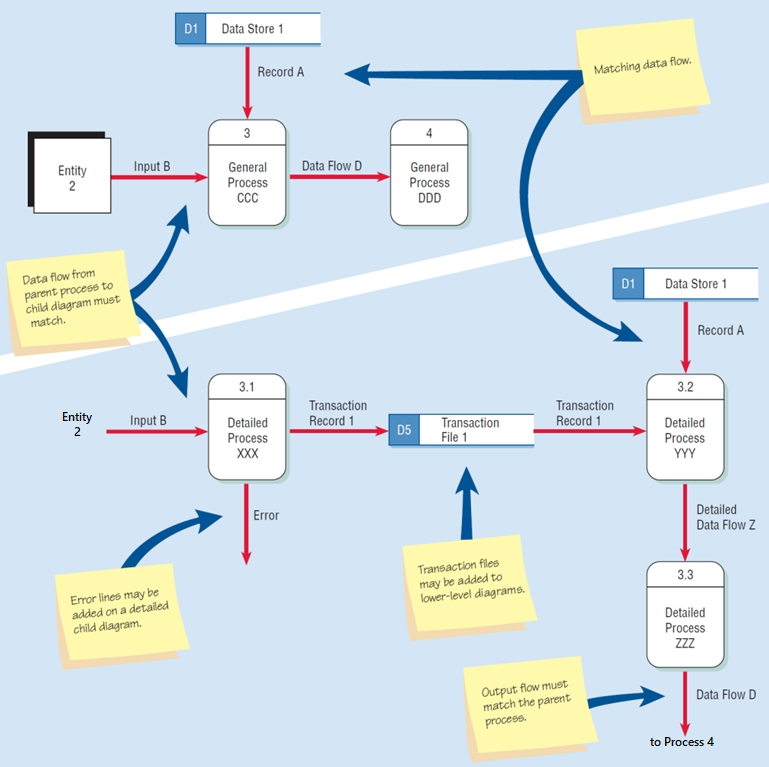
Differences between the Parent Diagram (above) and the Child Diagram (below)
Section 8: Choosing Level of Detail
A decision has to be made when to stop decomposition.
- Under-exploded diagrams may cause errors of omission that could lead to errors in system being developed.
- Over-developed diagrams may be too complex and waste time and reduce understandability.
Rules for stopping decomposition
- When each process has been reduced to a single decision,
calculation, or database operation.
- If a process involves more than two subprocesses, then it should be further decomposed.
- When each data store represents data about a single entity.
- When the system user does not care to see any more detail.
- When every data flow does not need to be split further to show that data are handled in various ways.
- When you believe that you have shown each business form or transaction, online display, and report as a single data flow.
- When you believe that there is a separate process for each choice on all lowest-level menu options.
- Rule of thumb: Stop when you can explain the process in one (or maybe two) sentences.
If you begin to decompose a process and end up with only two processes on the lower-level DFD, you have two options. Further reflection may reveal additional processes that you neglected to include in the decomposition. However, if you can envision no neglected processes you probably do not need to decompose it. Instead you should simply incorporate those two processes into the parent DFD.
Likewise, a DFD with more than nine processes becomes difficult for users to read and understand, because it is very complex and crowded. Some of these processes should be combined and explained on a lower-level DFD.
Section 9: Drawing DFDs
Tips for Creating DFDs
Because a data flow diagram is two-dimensional rather than linear, you can start at any point and work forward or backward through the diagram.
- Make a list of business activities.
- Analyze what happens to an input data flow from an external
entity, asking questions like
- What happens to data entering the system?
- Is it stored?
- Is it input for multiple processes?
- Work backwards from an output data flow, analyzing what is
necessary to create an output data flow to an external entity.
Examine the output field on a document or screen. For each
field ask
- Where does it come from?
- Is it calculated or stored in a file?
- Examine the data flow to or from a data store. Ask what processes put data in the store or use data from the store. Note that a data store used in the system may be produced by a different system, so there may not be an apparent flow into the store.
- Analyze a well-defined process. Examine the input data that the process needs and what output is produced. Then connect the input and output to the appropriate data stores and entities.
- Note any areas that are unclear and clarify them in a follow-up interview.
Guidelines for Drawing DFDs
- Completeness
- DFD must include all components necessary for the system.
- Each component must be fully described in the project dictionary or CASE repository.
- Consistency
- The extent to which information contained on one level of a set of nested DFDs is also included on other levels.
- Timing
- Time is not represented well on DFDs.
- It is best to draw DFDs as if the system has never started and will never stop.
- Iterative Development
- Analyst should expect to redraw the diagram several times before reaching the closest approximation to the system being modeled.
Section 10: Rules, Rules, and More Rules
Naming Conventions
- Processes: Use the form verb-adjective-noun for detailed processes (from Section 3).
- Data Stores: Named with a noun, describing the data (from Section 3).
- External Entities: Should be named with a noun, describing that entity (from Section 3).
- Data Flows: Names should be a noun that describes the data moving through the system (from Section 3).
Diagramming Guidelines
- The major data stores and all external entities are included on Diagram 0 (from Section 6).
- Since external entities are external to the system, they should be placed close to the periphery of the diagram (from Section 6).
- External entities can appear on a diagram more than once to avoid crossing data flow lines (from Section 6).
Major Rules
- The inputs to a process must be different from the outputs
of that process.
- The purpose of a process is to transform inputs into outputs.
- Objects on a DFD have unique names.
- Every process must have a unique name.
Basic Rules to Keep in Mind
- The context diagram must have one process.
- Must not be any freestanding objects.
- A process must have at least one input data flow and one output data flow.
- All data flows must EITHER originate or terminate at a process.
- Never split a data flow.
- External entities should not be connected to one another.
- External entities should not directly connect to data stores.
- Data stores should not directly connect to other data stores.
- The data flow in and out of a parent process must be present on the child diagram, and vice versa. Such flows should have identical names.
More Rules
- Each level has between 3 and 9 processes.
- Each lower-level diagram should fit on a single sheet of paper.
- Each process is numbered with an integer.
- Numbering generally starts at upper left corner and moves to lower right.
- Diagram 0 should include all major data stores and all external entities.
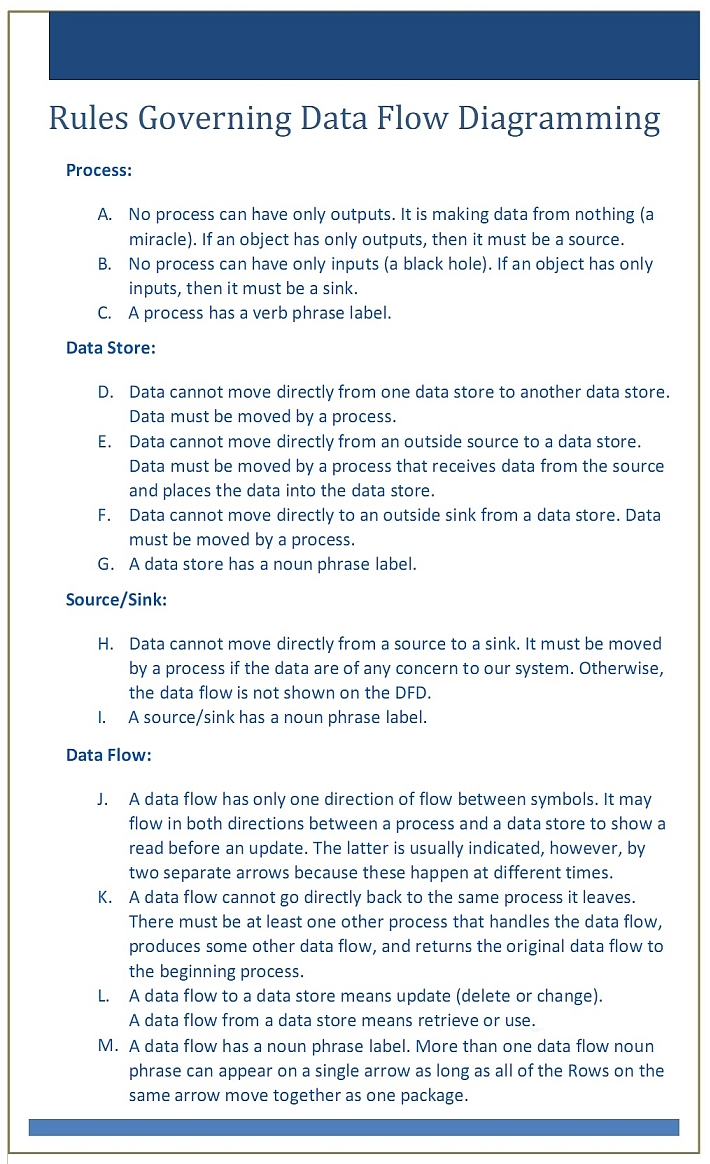
Data Flow Diagramming Rules
Section 11: Common Errors
The following conditions are errors that occur when drawing a data flow diagram:
- A process with only input data flow or only output data flow from it.
- Data stores or external entities are connected directly to each other, in any combination.
- Incorrectly labeling data flow or objects. Examples include:
- Labels omitted from data flow or objects.
- Data flow labeled with a verb.
- Processes labeled with a noun.
- Flows on child diagrams named differently than corresponding flows on parent diagrams. Service Report ≠ Service Agreement
- Too many processes on a data flow diagram.
- Nine is the suggested maximum.
- Omitting a data flow from the diagram.
- Unbalanced decomposition between a parent process
and a child diagram.
- The data flow in and out of a parent process must be present on the child diagram, and vice versa.
- Such flows should have identical names.
- Splitting a flow - see following figure.
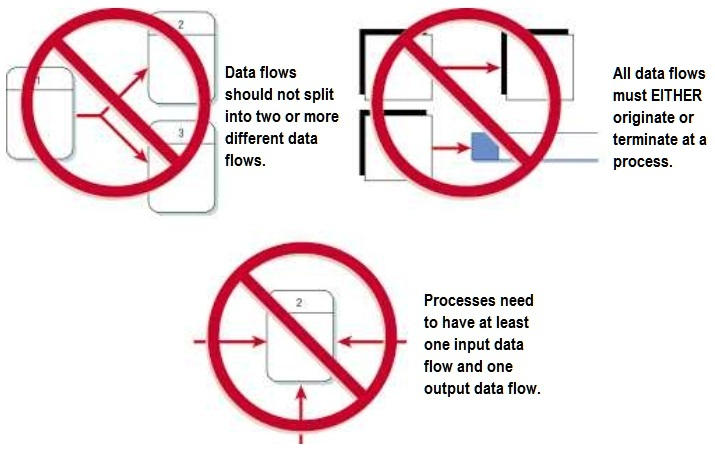
Common DFD Errors
Typical Errors (clickable example)
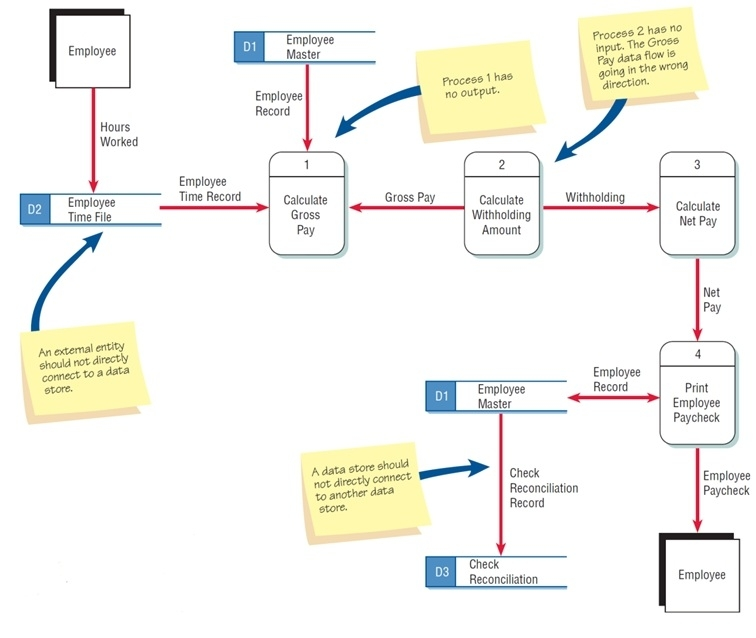
Typical Errors that Can Occur in a Data Flow Diagram (click image for correct version)
Section 12: Example #1
Writing a Research Paper
Step 1: Draw Context Diagram
- External Entities: Professor, Library
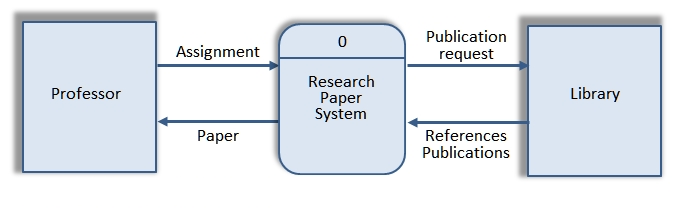
Research Paper Context Diagram.
The context diagram establishes the boundary between the system and the external environment, i.e., shows scope and boundary.
The next level, Level 0, provides provides details for the system description.
Step 2: Decompose processes – using the functional decomposition resulting from the example in the previous set of notes, we begin to develop the Level 0 DFD. Be sure to include external entities and data flows from context diagram.
Recall that the top level processes determined in the functional decomposition included
- determine topic
- perform research
- prepare draft
- finalize paper
Level 0 DFD: Write Research Paper
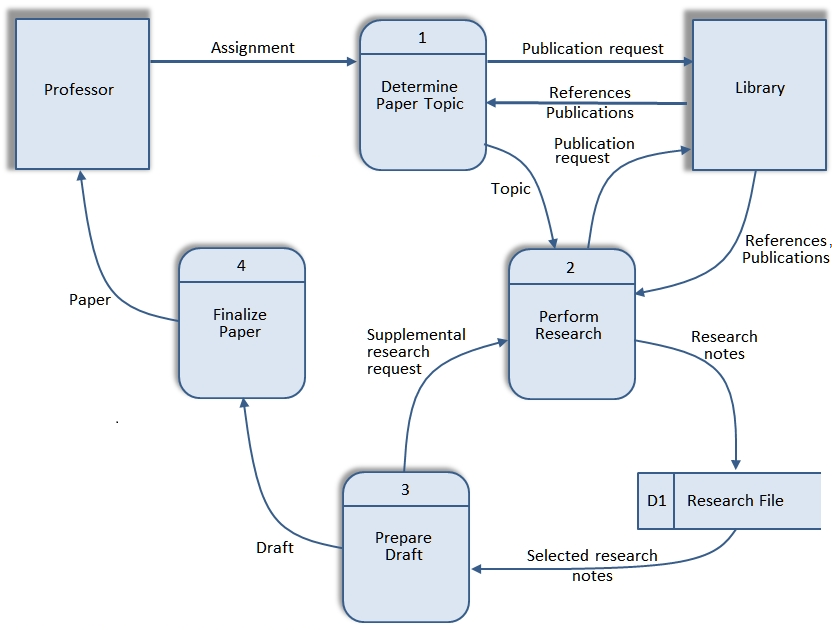
Level 0 DFD: Write Research Paper
Labels:
- be specific in names
- names should come from user organization
- function names: verb followed by object
- data flow, data store, entity names: noun or noun phrase
- two different flows can't have same label
Step 3: Expand each process on Diagram 0 in a Level 1 diagram of its own.
In this example, the Level 1 diagram will consist of four diagrams: Level 1 Diagram 1, Level 1 Diagram 2, Level 1 Diagram 3, and Level 1 Diagram 4.
Technique: Identify functions and what is needed to conduct functions.
For example, recall that the functional decomposition determined that Determine Paper Topic required the combined efforts of the following processes:
- review topic requirements
- list possible topics
- perform background research on topics
- evaluate topics
- select topic
Remember that every flow in or out of Determine Paper Topic process on Level 0 must be shown in Level 1 Diagram 1: Determine Paper Topic.
Boundary is sometimes indicated with dotted line.
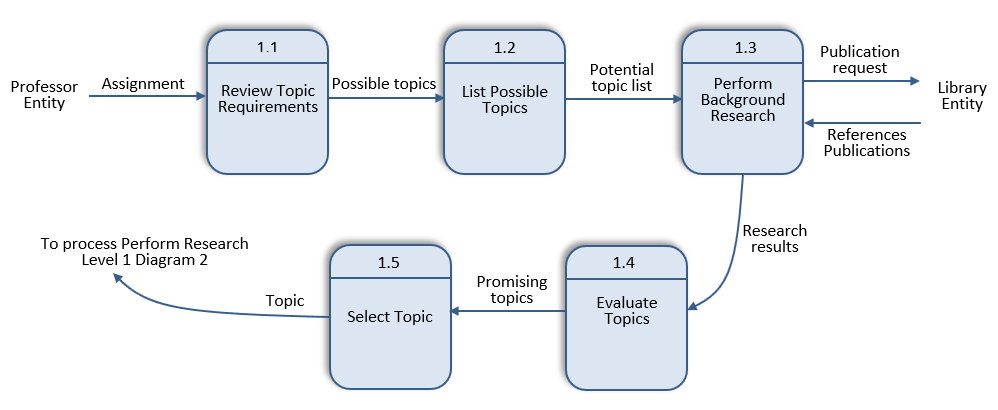
Level 1 Diagram 1: Determine Paper Topic
We do this for every process on Diagram 0, referring to the functional decomposition.
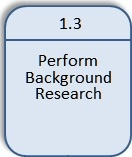
Step 4: Analyze every process in each Level 1 diagram to derive Level 2 diagrams
We won't take this example any farther, but if a process such as Level 1, Diagram 1, Process 1.3 (Perform Background Research) requires three or more tasks for it to be completed, then it should be decomposed into a Level 2 diagram.
- If a process cannot be further decomposed, functional primitives are provided for it, per the earlier discussion
-
Here is an example of functional primitives for "Determine Paper Topic".
- Review Topic Requirements - The student reviews the assignment given by the instructor to ensure that the requirements are understood.
- List Possible Topics - The student lists all possible topics that satisfy the requirements and are of interest to the student.
- Perform Background Research - The student performs Internet or library research on each potential topic to determine if sufficient material is available for the research paper, and may submit and receive reference material from the library per Interlibrary Loans.
- Evaluate Topics - The student will assess the available research material for all topics, determining those associated with adequate research material for developing a research paper.
- Select Topic - Given the list of topics adequate research material for developing a research paper, the student will select a topic that is of most interest.
Section 13: Example #2
Big Belly Burger Joint
Step 1: Draw Context Diagram
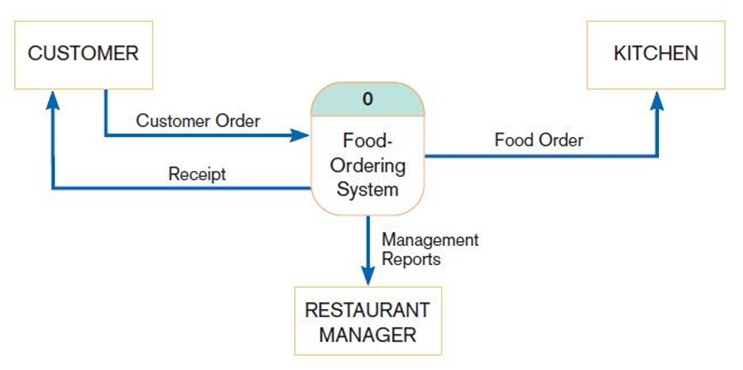
Big Belly Context Diagram
Step 2: Decompose process – list activities involved, and then group those activities into 3 to 9 major processes.
- Receive and Transform Customer Food Order
- Update Goods Sold File
- Update Inventory File
- Produce Management Reports
Step 3: Use major processes and external entities and data flows from context diagram to develop Level 0 DFD.
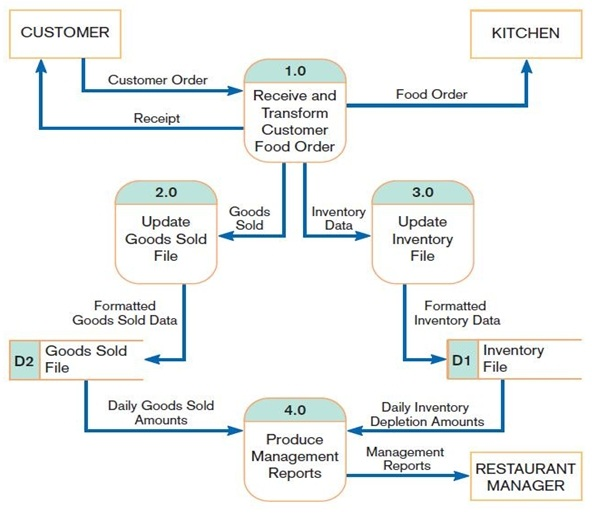
Big Belly Diagram 0
Step 4: Analyze each process in Level 0 to derive Level 1 diagrams.
The figure below shows a decomposition of Process 4: Produce Management Reports.
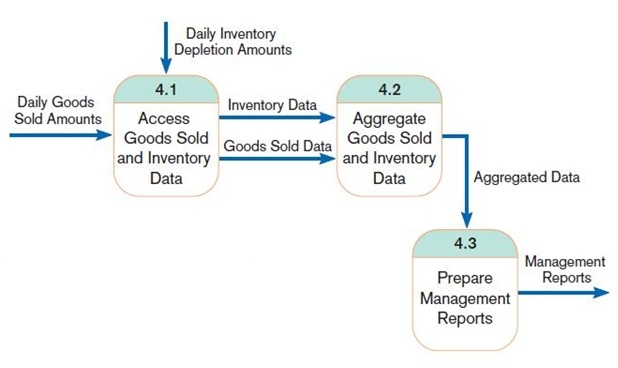
Big Belly Level 1 DFD
- This shows the decomposition of Process 4.
- A level 1 DFD shows the sub-processes of one of the processes in the Level 0 DFD.
- Processes are labeled 4.1, 4.2, etc. These can be further decomposed in more primitive (lower-level) DFDs if necessary.
Step 5: Analyze each process in Level 1 to derive Level 2 diagrams.
The example below shows the decomposition of Level 1, Diagram 4, Process 4.3 (Prepare Management Reports).
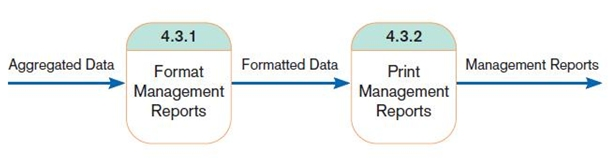
Big Belly Level 2 DFD
- This is a Level 2 DFD showing the decomposition of Process 4.3 from the level 1 diagram for Process 4.0 for Big Belly Burger’s food-ordering system.
- Level n DFD shows the sub-processes of one of the processes in the Level n-1 DFD.
- Processes are labeled 4.3.1, 4.3.2, etc. If this is the lowest level of the hierarchy, it is called a primitive DFD.
- Note that there are only two processes, which violates the guideline of 3-9 processes. Is this level then necessary?
Section 14: Logical and Physical Data Flow Diagrams
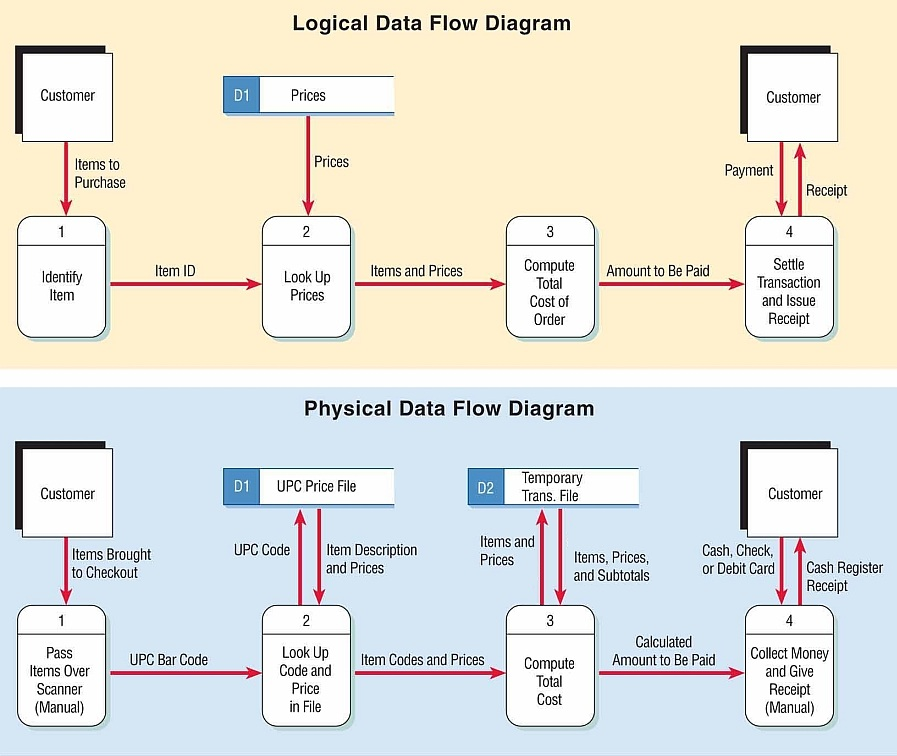
Logical
- Focuses on the business and how the business operates.
- Not concerned with how the system will be constructed.
- Describes the business events that take place and the data required and produced by each event.
- Have processes that would exist regardless of the type of system implemented.
Physical
- Shows how the system will be implemented, including hardware, software, files, and people involved in the system.
- Shows how the system operates or how the new system will be implemented.
- Physical data flow diagrams are used to:
- Clarify which processes are performed by humans and which are automated.
- Describe processes in greater detail.
- Sequence processes that have to be done in a particular order.
- Show temporary data stores and transaction files.
- Specify actual document and file names.
- Include controls to ensure that processes are performed properly.
-
Features Common of Logical and Physical Data Flow Diagrams Design Feature Logical Physical What the model depicts How the business operates. How the system will be implemented (or how the current system operates). What the processes represent Business activities. Programs, program modules, and manual procedures. What the data stores represent Collections of data regardless of how the data are stored. Physical files and databases, manual files. Type of data stores Show data stores representing permanent data collections. Master files, transition files. Any processes that operate at two different times must be connected by a data store. System controls Show business controls Show controls for validating input data, for obtaining a record (record found status), for ensuring successful completion of a process, and for system security (example: journal records).
-
Logical DFD Advantages Advantages of logical DFDs - Better communication with users
- More stable systems, since the design is based on a business framework
- Increased understanding of the business by analysts
- The system will have increased flexibility and be easier to maintain
- Elimination of redundancy and easier creation of the physical model
-
Physical DFD Contents Contents of Physical Data Flow Diagrams - Manual processes
- Processes for adding, deleting, changing, and updating records
- Data entry and verifying processes
- Validation processes for ensuring accurate data input
- Sequencing processes to rearrange the order of records
- Processes to produce every unique system output
- Intermediate data stores
- Actual file names used to store data
- Controls to signify completion of tasks or error conditions
Types of DFDs
- Current Logical
- Physical aspects of system are removed as much as possible.
- Current system is reduced to data and processes that transform them.
- Current Physical
- Process labels identify technology (people or systems) used to process the data.
- Data flows and data stores identify actual name of the physical media.
- Future Logical
- Includes additional functions.
- Obsolete functions are removed.
- Inefficient data flows are reorganized.
- Future Physical
- Represents the physical implementation of the new system.
Section 15: Progression of DFDs
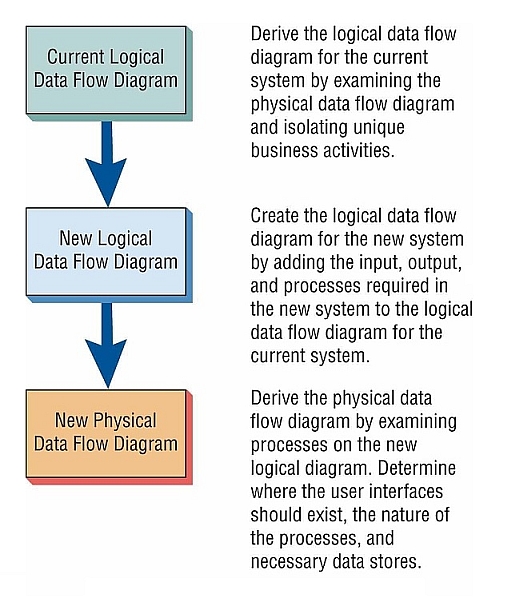
The progression of creating data flow diagrams is
- Create a logical DFD of the current system.
- Next add all the data and processes not in the current system that are required by the new system, and drop any unnecessary processes.
- Finally derive the physical data flow diagram for the new system.
This approach ensures that essential features of the old system are retained and provides for a gradual transition to the design of the new system.
DFD Progression
DFD Progression Example
CRUD
- Physical data flow diagrams include processes for adding, reading, changing, and deleting records.
- CRUD is an acronym for Create, Read, Update, Delete.
- A CRUD matrix can be used to show which programs or processes add, read, update, or delete master file records.
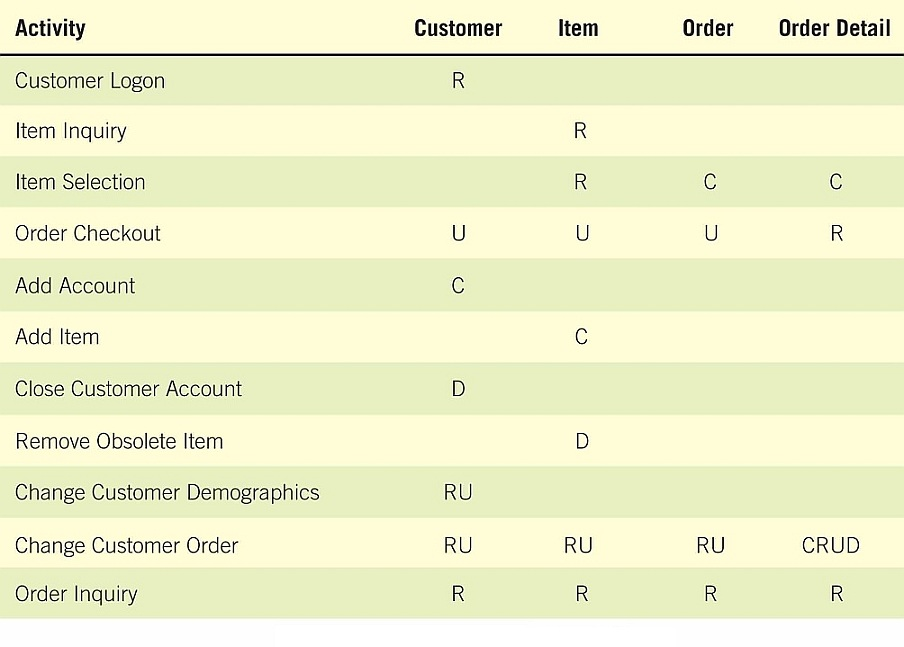
CRUD Matrix
Section 16: Partitioning Data Flow Diagrams
Partitioning is the process of examining a data flow diagram and determining how it should be divided into collections of manual procedures and computer programs.
- A dashed line is drawn around a process or group of processes that should be placed in a single computer program.
The reasons for partitioning a data flow diagram into separate computer programs are:
- Different user groups should have different programs.
- Processes that execute at different times must be in separate programs.
- Processes may be separated into different programs for security.
- Similar tasks may be included in the same program.
- Several batch processes may be included in the same program for efficiency.
- Several processes may be included in the same program or job stream for consistency of data.
Section 17: Using Data Flow Diagrams
Let's see another video: Data Flow Diagrams - Simply Put!
Data flow diagrams can be used for several different purposes:
- Unexploded data flow diagrams are useful to identify information requirements.
- Exploded data flow diagrams can be used for presentation, education, and gathering feedback information from users.
- DFDs may be used to analyze the system to ensure that the design is complete.
- DFDs are used to partition the system into programs.
- Data flow diagrams can be used for the system documentation.
Section 18: Sample Data Flow Diagrams
Here are links to a couple of sample DFDs that other professors have posted. I thought you might like to try your hand at a few that have answers. I have not reviewed them thoroughly, so if you see anything questionable, ask!
- Example 1 (html) (local backup)
- Example 2 (html)
- Example 3 (ppt)
- Example 4 (ppt)
- Example 5 (ppt)
- Example 6 (ppt)
- Example 7 (ppt)
- Example 8 (ppt)
- Example 9 (ppt)
- Example 10 (doc)
- Example 11 (doc)
- Example 12 (doc)
- Example 13 (doc)